User’s Guide Agilent Technologies 85671A Phase Noise Utility Manufacturing Part Number: 85671-90010 Printed in USA November 2000 © Copyright 1993 − 2000 Agilent Technologies
Notice The information contained in this document is subject to change without notice. Agilent Technologies makes no warranty of any kind with regard to this material, including but not limited to, the implied warranties of merchantability and tness for a particular purpose. Agilent Technologies shall not be liable for errors contained herein or for incidental or consequential damages in connection with the furnishing, performance, or use of this material.
Agilent Technologies Software Product License Agreement and Limited Warranty Important License Agreement Please carefully read this License Agreement before opening the media envelope or operating the equipment. Rights in the software are o ered only on the condition that the Customer agrees to all terms and conditions of the License Agreement. Opening the media envelope or operating the equipment indicates your acceptance of these terms and conditions.
Transfer of Rights in Software. Customer may transfer rights in the software to a third party only as part of the transfer of all their rights and only if Customer obtains the prior agreement of the third party to be bound by the terms of this License Agreement. Upon such a transfer, Customer agrees that their rights in the software are terminated and that they will either destroy their copies and adaptations or deliver them to the third party. Transfer to a U.S.
Limited Warranty Software. Agilent Technologies warrants for a period of 1 year from the date of purchase that the software product will execute its programming instructions when properly installed on the spectrum-analyzer instrument indicated on this package. Agilent Technologies does not warrant that the operation of the software will be uninterrupted or error free.
Safety Notes The following safety notes are used throughout this manual. Familiarize yourself with each of the symbols and its meaning before operating this instrument. Caution The caution note denotes a hazard. It calls attention to a procedure which, if not correctly performed or adhered to, could result in damage to or destruction of the instrument. Do not proceed beyond a caution sign until the indicated conditions are fully understood and met. Warning The warning note denotes a hazard.
How to Use This Guide Key Conventions. The following key conventions are used in this guide: 4Front-panel key5 Text shown like this represents a key physically located on the spectrum analyzer. Text shown like this represents a softkey. (The Softkey softkeys are located next to the softkey labels, and the softkey labels are the annotation on the right side of the spectrum analyzer display.) Screen Text Text printed in this typeface indicates text displayed on the instrument's screen.
Contents 1. Installing and Starting Copying the Phase Noise Utility . . . . . . . . . . Labeling a Softkey to Access the Phase Noise Utility Starting the Phase Noise Utility . . . . . . . . . . Using the Phase Noise Utility . . . . . . . . . . . Making A Log Plot Measurement . . . . . . . . . Removing the Phase Noise Utility . . . . . . . . . 2. Using the Phase Noise Utility Other Documentation . . . . . . . . . . . Speci cations and Characteristics . . . . . Functionality . . . . . . . . . . . . . . .
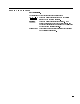
Figures 1-1. 1-2. 1-3. 2-1. Equipment Used With Phase Noise Utility . . . Con guration Screen . . . . . . . . . . . . . Log Plot Measurement . . . . . . . . . . . . 8560 E-Series and EC-Series System Noise Floor Characteristics . . . . . . . . . . . . . . 2-2. Main Menu . . . . . . . . . . . . . . . . . . 4-1. Log Plot of Drifty or Noisy Signal . . . . . . . . . . . . . . . . 1-1 1-6 1-7 . . . . . . . . . 2-4 2-5 4-2 2-1. O set Frequency Range Requirements . . . . . . . .
1 Installing and Starting The 85671A Phase Noise Measurement Utility is a down-loadable program (DLP) that is used with the 8560 E-Series and EC-Series spectrum analyzers. You need the following equipment to use the utility: Phase Noise Mass Memory Module Measurement Utility 85671A Spectrum Analyzer 85620A 8560A/E/EC ( rmware 890720 and later) ( rmware revision C, 8561A 910116 and later) 8561B/E/EC ( rmware 890720 and later) 8562A/B ( rmware 870728 and later) 8563A/E/EC Figure 1-1.
Copying the Phase Noise Utility The phase noise utility comes on two memory cards. The le is called PH_NOIS1 and PH_NOIS2. Copy the utility from both memory cards to the mass memory module. 1. With the spectrum analyzer turned o , attach the mass memory module to the spectrum analyzer. 2. Insert one of the 86571A memory cards into the module. Make sure the arrow on the card is facing the matching arrow on the rim of the module's card slot. 3. Turn on the spectrum analyzer.
Labeling a Softkey to Access the Phase Noise Utility Label a spectrum analyzer softkey to access the utility which is stored in the mass memory module. The utility includes the PH_SETUP program which can be run at any time to assign softkeys and to return the program variables to the default values. 1. With the mass memory module attached to the back of the spectrum analyzer press the 4MODULE5 key. 2. To verify that the utility is in the mass memory module, press the UTILITY .
Starting the Phase Noise Utility The phase noise utility can be started easily once the program is in the mass memory module and a spectrum analyzer's user key has been labeled to access it. The desired carrier signal should be visible on the spectrum analyzer before starting the utility. When the utility is started, it nds the largest signal in the current span and assumes this will be the carrier frequency. 1. With the mass memory module attached to the spectrum analyzer press 4MODULE5. 2.
Using the Phase Noise Utility The phase noise utility uses a series of softkey menus displayed along the right edge of the spectrum analyzer display. Use the EXIT ALL softkey to end the utility. NNNNNNNNNNNNNNNNNNNNNNNNNN Note DO NOT use other front-panel keys when the utility is running, except to enter data, or you will exit the utility prematurely.
Making A Log Plot Measurement A log plot measurement of phase noise is probably the most common use of the phase noise utility. See the following example. 1. Connect the front panel CAL OUTPUT to the INPUT 50 . 2. Make sure that the desired signal is on the display. When the utility is started it selects the highest displayed signal to measure. 3. Press 4MODULE5, USER KEYS , and PHASE NOISE . NNNNNNNNNNNNNNNNNNNNNNNNNNNNN NNNNNNNNNNNNNNNNNNNNNNNNNNNNNNNNNNN 4.
d a c b Figure 1-3. Log Plot Measurement 8. Press SET SPOT FRQ and change the spot frequency selection to a value between the minimum and maximum o set frequencies. 9. Press SMOOTH TRACE and 12 PTS 2% AVG . Notice that the amount of smoothing that is currently selected is marked with an * (asterisk). Select di erent amounts of smoothing and notice the e ects on the trace.
Removing the Phase Noise Utility The phase noise utility can be removed from the mass memory module using a program included on the 85671A memory card. 1. Make sure the module is attached to the spectrum analyzer. (Always turn o the power before attaching or removing the mass memory module.) 2. Press 4MODULE5 key. Then press KEYDEF and CHOOSE DLP . NNNNNNNNNNNNNNNNNNNN NNNNNNNNNNNNNNNNNNNNNNNNNNNNNNNN 3.
2 Using the Phase Noise Utility This chapter includes the following: Speci cations and Characteristics Functionality The Main Menu Log Plot Measurements Spot Frequency Measurements RMS Phase Noise Measurement Smoothing, Averaging, or Filtering Signal Tracking Printing and Plotting Saving and Recalling Traces Measurement Considerations O sets 1 MHz Slowly Drifting Signals System Noise Floor Use of the Bottom Division of the Display Other Documentation The document listed below provides information on maki
Speci cations and Characteristics Speci cations shown are based on operation of the phase noise utility with an 8560 E-Series or 8560 EC-Series spectrum analyzer. Measurement characteristics Measurement modes Measure log plot Measure spot frequency RMS Noise Maximum number of decades 5 (whole decades only) Filtering (ratio of video bandwidth to resolution bandwidth) None (VBW/RBW=1) Little (VBW/RBW=0.3) Medium (VBW/RBW=0.1) Maximum (VBW/RBW=0.
Input signal level Maximum +17 dBm (ref level = 050 dBc/Hz) Minimum (for optimum dynamic range) 017 dBm (o sets 100 kHz, 10 dB input attenuation) Measurement Accuracy (characteristic) Amplitude accuracy 62.5 dB ( 10 dB above system noise oor) Log graph frequency accuracy 6 5% Amplitude repeatability see table below Filtering Repeatability Characteristics* No Smoothing 12 point Smoothing 615 dB 65 db 612 dB 64 dB 67 dB 62.5 dB 64 dB 61.
Figure 2-1.
Functionality The Main Menu The utility's main function is to make phase noise measurements. It also has several other functions to make the measurements easier to make, save, compare, and print. When the phase noise program is started, the screen displays the main menu of softkeys and the con guration parameters as shown in Figure 2-2. The con guration parameters are either the default set for the rst time the program is run, or they are the same as the last time the program was used.
other keys, such as 4PRESET5, will exit the utility but may leave it in a state that will cause unpredictable results the next time the utility is started. Log Plot Measurements The log plot measurement approximates an exponential frequency sweep with p a set of linear sweeps pieced together to give a display of dBc/ Hz vs. logarithmic frequency o set. Trace B, which is the dimmer trace, displays the point-by-point data as measured. Trace A, the brighter trace, displays a smoothed version of trace B.
NNNNNNNNNNNNNNNNNNNNNNNNNNNNNNNNNNNNNN sideband. Choose SMOOTH TRACE to display a menu of softkeys that allow di erent amounts of smoothing. Each amount of smoothing may be tried without redrawing the entire screen. When the desired amount is displayed, the smoothing menu exit key PREVIOUS MENU is pressed and the screen is redrawn to re ect any new spot frequency amplitude change that is caused by the change in smoothing. Trace averaging can be used when making spot frequency measurements.
monochrome printers, such as the HP ThinkJet. The printer needs to have its GPIB address set to 1. The PRINT COLOR softkey should be used with HP PaintJets. Their GPIB addresses should also be set to 1. Log plot measurements include both trace A and trace B. An easy way to display just the smoothed information from trace A is to save trace A and recall it to trace B. This makes both traces contain the same data so that only the smoothed trace shows for use in a hard copy output.
Measurement Considerations O sets 1 MHz For measurements at o sets of 1 MHz the spectrum analyzer noise oor is usually about 0133 dBm. To get this measurement range you must select 0 dB input attenuation before entering the utility. Caution Input attenuation helps protect the spectrum analyzer input from being damaged by too much power from the device being tested. The use of 0 dB input attenuation should be minimized to protect the spectrum analyzer.
Frequency O set Limitations You de ne the range of o set frequencies to be measured using the MIN OFFSET FREQ and MAX OFFSET FREQ functions. There are limits on the number of signi cant digits entered when setting the minimum and maximum o set frequencies. The entry will be rounded to the nearest acceptable value. The o set range must be set to multiples of a decade, between 1 and 5 decades. There are limitations on how small the o set range can be.
3 Softkey Menus and Descriptions d a c b Softkey Menus and Descriptions 3-1
3-2 Softkey Menus and Descriptions d a c b
d a c b Softkey Menus and Descriptions 3-3
3-4 Softkey Menus and Descriptions d a c b
d a c d b a c b Softkey Menus and Descriptions 3-5
xxxxxxxxxxxxxxxxxxxx xxxxxxxxxxxxxxxxxxxxxxx 33333333333333333333 33333333333333333333333 12 PTS 96 PTS 2% AVG through 16% AVG sets the amount of trace smoothing to be used on a log plot measurement. A running average is taken with the selected quantity of trace points from trace B being averaged and put into trace A. The indicated averaging is based on there being 601 points in a trace. NNNNNNNNNNNNNNNNNNNNNNNNNNNNN Press front-panel keys 4MODULE5, USER KEYS , and PHASE NOISE .
NNNNNNNNNNNNNNNNNNNN CONFIG brings up the softkeys that allow the measurement parameters to be changed. They are displayed on the initial screen, the one that accompanies the main menu keys. NNNNNNNNNNNNNNNNNNNNNNNNNNNNN Press front-panel keys 4MODULE5, USER KEYS , and PHASE NOISE . NNNNNNNNNNNNNNNNNNNNNNNNNNNNNNNNNNN xxxxxxxxxxxxxx EXIT ALL 33333333333333 exits the phase noise utility and recalls the original state that was saved in state 9 when the phase noise program was rst invoked.
xxxxxxxxxxxxxxxxxxxx FILTER TRACE 33333333333333333333 sets how much video ltering is to be applied when the phase noise measurement is done. More ltering will increase the accuracy and repeatability of the measurement, but will take a longer time. The di erent softkeys change the ratio of the video bandwidth to the resolution bandwidth, changing the amount of ltering. There are four di erent levels of ltering available. An asterisk denotes the current setting.
xxxxxxxxxxxxxx MAIN MENU 33333333333333 xxxxxxxxxxxxxxxxxxxxxxxxxx MAX FREQ OFFSET 33333333333333333333333333 exits the current menu and brings up the phase noise utility's main menu softkeys. It also causes the con guration screen to be displayed or updated. prompts the user for a new maximum o set frequency. This value is the maximum o set frequency displayed by a log plot measurement.
NNNNNNNNNNNNNNNNNNNNNNNNNNNNNNNNNNNNNNNNNNNNNNNNNN When the MEASURE SPOT FRQ key is pressed a new set of softkeys becomes available to enable ltering, averaging, and changing the spot frequency. The utility measures only the upper noise sidebands. NNNNNNNNNNNNNNNNNNNNNNNNNNNNN Press front-panel keys 4MODULE5, USER KEYS , and PHASE NOISE . If a user key has been assigned, press 4MODULE5, USER KEYS .
xxxxxxxxxxxxxxxxx PRINT B&W 33333333333333333 initiates a screen dump to an attached black and white GPIB printer that supports HP raster graphics, such as an HP ThinkJet. The printer's GPIB address must be set to 1. All of the display is printed with the exception of the softkeys. The printer must be set up correctly. It must be turned on, have paper loaded, have the correct address, and be connected.
xxxxxxxxxxxxxxxxxxxxxxx xxxxxxxxxxxxxxxxxxxxxxx 33333333333333333333333 33333333333333333333333 PLOT PLOT TRACE A and TRACE B send a single trace to an attached GPIB plotter. These keys are useful to plot traces from separate measurements onto a single plot in order to compare them. Execution of these commands are much faster than using the PLOT ALL key. NNNNNNNNNNNNNNNNNNNNNNNNNN The plotter must be set up correctly. It must be turned on, have paper loaded, have the correct address, and be connected.
xxxxxxxxxxxxxxxxx REF LEVEL 33333333333333333 p changes the dBc/ Hz value corresponding to the top graticule line for the log plot display. The reference level may need to be changed depending on the phase noise level of the source and the frequency o set range being measured. Pressing this softkey accesses softkeys that can be used to select reference levels of 020 dBc, 030 dBc, 040 dBc, or 050 dBc. An asterisk denotes the current setting.
Trace B may be saved by selecting NONE for smoothing, which will make trace A identical to trace B, and then saving trace A. The trace may be saved in more than one register if desired. The PREVIOUS MENU softkey must be pressed to exit this menu. Press front-panel keys 4MODULE5, USER KEYS , PHASE NOISE , MEASURE LOG PLOT , and MORE 1 OF 2 .
The function takes a running average of points across the screen from trace B and puts the average into trace A. The number of points to be averaged is selectable by softkeys once the SMOOTH TRACE key has been pressed. Each softkey label shows the number of points to averaged and the associated percent averaging, which is the number of points in the average divided by the total number of points in the trace (601). An asterisk denotes the current setting.
xxxxxxxxxxxxxxxxxxxxxxxxxxxxxxxxxxxxxx TURN ON(OFF) TRC AVG 33333333333333333333333333333333333333 toggles trace averaging on and o . Trace averaging averages successive traces to reduce the peak to peak amplitude of the noise, since noise is not correlated from sweep to sweep. Like video ltering, trace averaging gives a more repeatable result. NNNNNNNNNNNNNNNNNNNNNNNNNNNNN Press front-panel keys 4MODULE5, USER KEYS , PHASE NOISE , and MEASURE SPOT FRQ .
4 If You Have A Problem Signal disappears during measurement If the output frequency of the device under test is sensitive to changes in match, such as an unbu ered oscillator, the signal may disappear during the measurement process. The input attenuation, and therefore the input match, of the spectrum analyzer is varied during the measurement process. A bu er (attenuation and/or ampli cation) between the device and the spectrum analyzer may be required.
a log plot measurement. The maximum drift rate will depend on settings such as minimum o set frequency and the amount of averaging. Depending on the direction of drift, the phase noise will appear either higher or lower than it actually is. Log Plot Measurement d has unexpected discontinuities c Figure 4-1. Log Plot of Drifty or Noisy Signal Discontinuities like those shown in Figure 4-1 can occur if the minimum frequency o set is less than the residual FM of the signal.
Cannot change the con guration parameters All of the parameters on the con g screen are set to zero and they cannot be changed if the setup program has not been run. Exit the utility and use the KEYDEF softkeys to choose and execute the PH_SETUP program. This will initialize the program parameters. NNNNNNNNNNNNNNNNNNNN Spectrum analyzer states were lost The phase noise utility should not be invoked if a state is already saved in state 9 that must not be overwritten.
Index 1 12 PTS 2% AVG softkey, 3-6 2 24 PTS 4% AVG softkey, 3-6 4 48 PTS 8% AVG softkey, 3-6 9 96 PTS 16% AVG softkey, 3-6 A accessing the utility, 1-4 averaging, 2-6, 3-15.
Index-2 G GENERAL INFO softkey, 3-8 general safety considerations, vi H HARD COPY softkey, 3-8 help menu, 3-3 I installing the utility, 1-2 L labeling the softkey, 1-3 log plot measurement, 3-9 log plot measurements, 2-6 log plot menu, 3-4 LOWER LIMIT softkey, 3-8 M main menu, 2-5, 3-1 MAIN MENU softkey, 3-8 MAX FREQ OFFSET softkey, 3-9 maximum o set frequency, 2-10 measure log plot menu, 3-4 MEASURE LOG PLOT softkey, 3-9 measurement example, 1-6 measure spot frequency menu, 3-5 MEASURE SPOT FRQ s
Q quit the utility, 3-7 R recalling traces, 2-8 RECALL TO TR A softkey, 3-12 RECALL TO TR B softkey, 3-12 recall trace menu, 3-5 RECALL TRACE softkey, 3-12 REF LEVEL softkey, 3-12 REF LVL DOWN softkey, 3-6 REF LVL UP softkey, 3-6 removing the utility from memory, 1-8 RMS NOISE softkey, 3-13 RMS phase noise, 2-6 running the utility, 1-4 S safety, vi safety symbols, vi SAVE TRACE A softkey, 3-13 save trace menu, 3-5 saving traces, 2-8 SET SPAN softkey, 3-6 SET SPOT FRQ softkey, 3-14 signal tracking, 3-15