Errata Title & Document Type: 71500A and 70820A Microwave Transition Analyzer Quick Start Guide Manual Part Number: 70820-90047 Revision Date: November 1, 1992 HP References in this Manual This manual may contain references to HP or Hewlett-Packard. Please note that HewlettPackard's former test and measurement, semiconductor products and chemical analysis businesses are now part of Agilent Technologies. We have made no changes to this manual copy.
Quick Start Guide HP 71500A and HP 70820A Microwave Transition Analyzer ABCDE HP Part No. 70820-90047 Printed in USA Edition B.0.
Notice The information contained in this document is subject to change without notice. Hewlett-Packard makes no warranty of any kind with regard to this material, including, but not limited to, the implied warranties of merchantability and tness for a particular purpose. Hewlett-Packard shall not be liable for errors contained herein or for incidental or consequential damages in connection with the furnishing, performance, or use of this material. Restricted Rights Legend.
General Safety Considerations WARNING Before this instrument is switched on , make sure it has been properly grounded through the protective conductor of the ac power cable to a socket outlet provided with protective earth contact. Any interruption of the protective (grounding) conductor, inside or outside the instrument, or disconnection of the protective earth terminal can result in personal injury. WARNING There are many points in the instrument which can, if contacted, cause personal injury.
HP 71500A Microwave Transition Analyzer - At A Glance This quick start guide contains two tutorials that introduce you to the microwave transition analyzer. You'll need about 20 minutes to complete the steps. After completing the tutorial, refer to the HP 71500A and HP 70820A User's Guide for a complete discussion of product features. Why are there two tutorials For optimum performance as a stimulus-response test system, your microwave transition analyzer is designed to control a signal source.
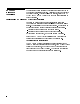
The INST PRESET key (instrument preset key) sets the microwave transition analyzer to a preset condition. The RF Input 1 Connector is one of the two inputs to the HP 71500A. The menu softkeys allow access to two pages of primary functions. To access the second page, press the bottom softkey. The lower-level softkeys give users a wide range of choices in most menus. The numerical keypad and knob are used to manually enter data. The custom keypad supplies quick access to common instrument functions.
In the text of this quick start guide, 4boxed5 letters indicate normal front-panel keys. NNNNNNNNNNNNNNNNNNNN shadow letters indicate softkeys.
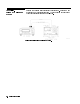
1 Quick Start Guide Contents Tutorial 1. Using a Con gured System Step 1. Display a continuous wave signal : : : : : : : : : : : : : : : : : : : : : 9 Step 2. Save a trace : : : : : : : : : : : : : : : : : : : : : : : : : : : : : : : : : : : : : : : : 10 Step 3. Use the noise lter : : : : : : : : : : : : : : : : : : : : : : : : : : : : : : : : : : 10 Step 4. Use the markers menu : : : : : : : : : : : : : : : : : : : : : : : : : : : : : : 10 Step 5.
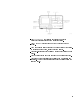
Tutorial 1. Using a Configured System Perform the tasks in this tutorial in the order given. Doing them out of sequence may require extra steps. The time needed to nish all of these tasks is usually less than 20 minutes. Cable connections in a configured system.
Step 1. Display a continuous wave signal 1. Connect a cable between your signal source output and the input to the microwave transition analyzer's RF INPUT 1. 2. Connect a cable between the rear-panel MOD OUTPUT of the HP 70820A module and the signal source's pulse modulation input. 3. Press 4INSTR PRESET5. 4. Press RF out ON|OFF until ON is underlined. NNNNNNNNNNNNNNNNNNNNNNNNNNNNNNNNNNNNNNNNN NNNNNNNN You should now have a continuous wave (CW) signal on the screen.
NNNNNNNNNNNNNNNNNNNN Step 2. Save a trace 1. Press Traces to enter the Traces menu. 2. Press the following softkeys: NNNNNNNNNNNNNNNNNNNNNNNNNNNNNNNNNNN store trace NNNNNNNNNNNNNNNNNNNNNNN TO MEM1 This saves the trace on the screen in memory block number 1. NNNNNNNNNNNNNN Step 3. Use the noise filter 1. Press Main to enter the Main menu. 2. Press noisflt ON|OFF until ON is underlined. NNNNNNNNNNNNNNNNNNNNNNNNNNNNNNNNNNNNNNNNNNNN NNNNNNNN This lters the noise on the signal.
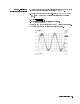
6. Get into the Main menu by pressing the following softkeys: NNNNNNNNNNNNNNNNNNNNNNNNNNNNNNNNNNN page 2 of 2 NNNNNNNNNNNNNN Main 7. Press RF out ON|OFF until ON is underlined. NNNNNNNNNNNNNNNNNNNNNNNNNNNNNNNNNNNNNNNNN NNNNNNNN The signal should look similar to the following gure. The top trace (Tr1) shows the real input data. The burst of RF is used only for visual e ect. The bottom trace (Tr3) shows the demodulated signal from the input at channel 1.
Step 7. Store internal settings (states) 1. Get into the States menu by pressing the following softkeys: NNNNNNNNNNNNNNNNNNNNNNNNNNNNNNNNNNN page 1 of 2 NNNNNNNNNNNNNNNNNNNN States 2. Press the following softkeys: NNNNNNNNNNNNNNNNNNNNNNNNNNNNNNNN save state NNNNNNNNNNNNNNNNNNNNNNNNNNNNNNNNNNNNNN SAVE STATE 1 The instrument will save the state in memory even if power is cycled. We will recall this state later. NNNNNNNNNNNNNNNNNNNNNNN Step 8. Use the automatic measurements table 1.
Step 9. Remove the automatic measurements table from the screen 1. Press the following softkeys: NNNNNNNNNNNNNNNNNNNNNNNNNNNNNNNNNNNNNNNNNNNN update: SINGLE NNNNNNNNNNN OFF 2. Get into the Markers menu by pressing the following softkeys: NNNNNNNNNNNNNNNNNNNNNNNNNNNNNNNNNNN page 2 of 2 NNNNNNNNNNNNNNNNNNNNNNN Markers 3. Press MARKERS OFF . NNNNNNNNNNNNNNNNNNNNNNNNNNNNNNNNNNN You have just deleted the automatic measurements table and the markers from the screen. NNNNNNNNNNNNNN Step 10.
4. Change the channel of measurement to channel 1 by pressing the following softkeys: NNNNNNNNNNNNNNNNNNNNNNNNNNNNNNNNNNN page 1 of 2 NNNNNNNNNNNNNNNNNNNNNNN Measure NNNNNNNNNNNNNNNNNNNNNNNNNNNNNNNNNNN MsrTrc: TR3 NNNNNNNNNNN TR1 5. Separate the RF from the video feedthrough and display the RF by pressing the following softkeys: NNNNNNNNNNNNNNNNNNNNNNNNNNNNNNNNNNN page 2 of 2 NNNNNNNNNNNNNNNNNNNNNNNNNNNNNNNNNNNNNNNNNNNN NNNNNNNN noisflt ON|OFF until ON is underlined.
NNNNNNNNNNNNNNNNNNNNNNNNNNNNNNNN AUTO-SCALE The following gure has an example of what you might expect to nd on the screen for this signal source or another of its quality. 7.
Step 12. Measure the risetime of an RF pulse 1. Press the following keys to change the time per division shown on the screen: NNNNNNNNNNNNNNNNNNNNNNN SEC/DIV 425 NNNNNNNN ns 2. If necessary, press delay and adjust the delay with the front-panel knob until the leading edge of the pulse is displayed. 3. Get into the Measure menu by pressing the following softkeys: NNNNNNNNNNNNNNNNN NNNNNNNNNNNNNNNNNNNNNNNNNNNNNNNNNNN page 1 of 2 NNNNNNNNNNNNNNNNNNNNNNN Measure 4.
NNNNNNNNNNNNNNNNNNNN Step 13. Measure the falltime of an RF pulse 1. Press States to access the States menu. 2. Press the following softkeys to get the RF pulse that you saved states for earlier, back on the screen: NNNNNNNNNNNNNNNNNNNNNNNNNNNNNNNNNNNNNN recall state NNNNNNNNNNNNNNNNNNNNNNNNNNNNNNNNNNNNNNNNNNNN RECALL STATE 1 3. Adjust delay by pressing the following keys: NNNNNNNNNNNNNNNNN DELAY 415 NNNNNNNN us 4.
6. Press the following softkeys to make trace 3 the trace to be measured: NNNNNNNNNNNNNNNNNNNNNNNNNNNNNNNNNNNNNN Msr Trc: TR1 NNNNNNNNNNN TR3 7. Press more 1 of 3 and then FALLTIME . Note the automatic measurements that appear at the top of the screen. NNNNNNNNNNNNNNNNNNNNNNNNNNNNNNNNNNN Tutorial 2. Using an Unconfigured System NNNNNNNNNNNNNNNNNNNNNNNNNN Perform the tasks in this tutorial in the order given. Doing them out of sequence may require extra steps.
NNNNNNNNNNNNNNNNNNNN Step 1. Measure frequency and power NNNNNNNNNNNNNNNNNNNNNNNNNNNNN NNNNNNNNNNNNNNNNNNNNNNN NNNNNNNNNNNNNN 1. Press Config , RF Source , RF src: , and then NONE to ensure your source is uncon gured. 2. Connect the oscillator under test to the channel 1 input as shown below. 3. Set the oscillator frequency to 3.1 GHz and its output power level to 02.1 dBm. Turn the oscillator power on. 4. Press 4INSTR PRESET5. 5. Press more 1 of 2 . NNNNNNNNNNNNNNNNNNNNNNNNNNNNNNNNNNN 6.
The results of this measurement are displayed on the screen as shown below. The displayed measurement reads 03.82 dBm when the input is 02.1 dBm because the cable loss is fairly heavy for this particular setup. This procedure is for a frequency and power measurement of one input. The microwave transition analyzer system can, however, determine the frequency and power of up to ve signals at one time.
Step 2. Normalize the system for a vector 1. Connect the signal source to a power splitter and the microwave transition analyzer system as shown below.
2. Set the frequency of the signal source to 1 GHz and the power level to 010.0 dBm. 3. Press 4INSTR PRESET5. 4. Access the States menu by pressing the following softkeys: NNNNNNNNNNNNNNNNNNNNNNNNNNNNNNNNNNN page 1 of 2 NNNNNNNNNNNNNNNNNNNN States 5. Press VECTOR VOLTAGE . You should now have only a table on the screen. The source signal is no longer visible on the screen. 6.
Step 3. Make a vector voltage measurement 1. Connect the device under test (DUT) to the normalized measurement setup as shown below. 2. Read the results at the top of the screen as shown below. The example shows the measurements for a 1.5 GHz low-pass lter. The left number in the table shown on the screen is the input frequency. The center number shows the insertion loss of the DUT. The right number shows the phase shift caused by the DUT.