
User`s guide


Chapter 7 7-129
Programming Examples
Limit Line and Data Point Special Functions
Figure 7-3 Limit Segments Versus Limit Lines
Limit Segments
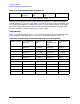
The values in the table below were used to create the limit lines in Figure 7-3.
Table 7-12 Limit Segment Table for Figure 7-3
Segment Num. Stimulus
(Frequency)
Upper Limit
(dB)
Lower Limit
(dB)
Limit Type
Channel 1
1 200 MHz 2 −2 Flat Line (FL)
2* 500 MHz 2 −2 Single Point (SP)
3 1000 MHz 0.5 −0.5 Slope LIne (SL)
4* 2000 MHz 1 0 Single Point (SP)
5 3000 MHz −0.5 −1.5 Single Point (SP)
6 4000 MHz 0 −2 Flat Line (FL)
7 4800 MHz 1 −1 Flat Line (FL)
Channel 2
1 500 MHz 2.5 −2.5 Flat Line (FL)
2 1100 MHz 2 −2 Single Point (SP)
3 2500 MHz 1.5 −1.5 Flat Line (FL)
4* 4500 MHz 1.5 −1.5 Single Point (SP)
5 5000 MHz 1.5 −10 Slope Line (SL)
6 5800 MHz 0 −5 Slope Line (SL)