
User`s guide
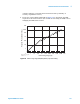


Table Of Contents
- Title Page
- Contents
- Getting Started
- Introduction and Measurement
- Phase Noise Basics
- Expanding Your Measurement Experience
- Starting the Measurement Software
- Using the Asset Manager
- Using the Server Hardware Connections to Specify the Source
- Setting GPIB Addresses
- Testing the 8663A Internal/External 10 MHz
- Testing the 8644B Internal/External 10 MHz
- Viewing Markers
- Omitting Spurs
- Displaying the Parameter Summary
- Exporting Measurement Results
- Absolute Measurement Fundamentals
- Absolute Measurement Examples
- Residual Measurement Fundamentals
- What is Residual Noise?
- Assumptions about Residual Phase Noise Measurements
- Calibrating the Measurement
- Measurement Difficulties
- Residual Measurement Examples
- FM Discriminator Fundamentals
- FM Discriminator Measurement Examples
- AM Noise Measurement Fundamentals
- AM Noise Measurement Examples
- Baseband Noise Measurement Examples
- Evaluating Your Measurement Results
- Advanced Software Features
- Reference Graphs and Tables
- Approximate System Noise Floor vs. R Port Signal Level
- Phase Noise Floor and Region of Validity
- Phase Noise Level of Various Agilent Sources
- Increase in Measured Noise as Ref Source Approaches DUT Noise
- Approximate Sensitivity of Delay Line Discriminator
- AM Calibration
- Voltage Controlled Source Tuning Requirements
- Tune Range of VCO for Center Voltage
- Peak Tuning Range Required by Noise Level
- Phase Lock Loop Bandwidth vs. Peak Tuning Range
- Noise Floor Limits Due to Peak Tuning Range
- Tuning Characteristics of Various VCO Source Options
- 8643A Frequency Limits
- 8644B Frequency Limits
- 8664A Frequency Limits
- 8665A Frequency Limits
- 8665B Frequency Limits
- System Specifications
- System Interconnections
- PC Components Installation
- Overview
- Step 1: Uninstall the current version of Agilent Technologies IO libraries
- Step 2: Uninstall all National Instruments products.
- Step 3: Install the National Instruments VXI software.
- Step 4: Install the National Instruments VISA runtime.
- Step 5: Install software for the NI Data Acquisition Software.
- Step 6: Hardware Installation
- Step 7. Finalize National Instruments Software Installation.
- Step 8: System Interconnections
- Step 9: Install Microsoft Visual C++ 2008 Redistributable Package use default settings
- Step 10: Install the Agilent I/O Libraries
- Step 11: Install the E5500 Phase Noise Measurement software.
- Step 12: Asset Configuration
- Step 13: License Key for the Phase Noise Test Set
- Overview
- PC Digitizer Performance Verification
- Preventive Maintenance
- Service, Support, and Safety Information
- Safety and Regulatory Information
- Safety summary
- Equipment Installation
- Environmental conditions
- Before applying power
- Ground the instrument or system
- Fuses and Circuit Breakers
- Maintenance
- Safety symbols and instrument markings
- Regulatory Compliance
- Declaration of Conformity
- Compliance with German noise requirements
- Compliance with Canadian EMC requirements
- Service and Support
- Return Procedure
- Safety and Regulatory Information

124 Agilent E5505A User’s Guide
5
Absolute Measurement Fundamentals
Evaluating Noise Above the Small Angle Line
If the average noise level on the input signals exceeds approximately 0.1
radians RMS integrated outside of the Phase Lock Loop (PLL) bandwidth, it
can prevent the system from attaining phase lock.
The following procedure allows you to evaluate the beatnote created between
the two sources being measured. The intent is to verify that the PLL
bandwidth is adequate to prevent the noise on the two sources from causing
the system to lose lock.
If the computer is displaying the hardware Connect Diagram you are ready to
begin this procedure. (If it is not, begin a New Measurement and proceed until
the hardware Connect Diagram appears on the display.)
Determining the Phase-Lock-Loop bandwidth
1
Determine the Peak Tuning Range (PTR) of your VCO by multiplying the
VCO Tuning Constant by the Tune Range of VCO value entered. (If the
phase noise software has measured the VCO Tuning Constant, use the
measured value.)
For Example:
2
Estimate the Phase Lock Loop (PLL) bandwidth for the measurement using
the PTR of your VCO and the graph in Figure 81.
Observing the beatnote
If the beatnote frequency is below 100 kHz it appears on the Agilent E4411A
RF analyzer’s display in both the frequency domain and the time domain. If
the beatnote does not appear on the RF analyzer, then the beatnote is either
greater than 100 kHz or it does not exist.
If incrementing the frequency of one of the sources does not produce a
beatnote within 100 kHz, you need to verify the presence of an output signal
from each source before proceeding.
TuningVoltage X ConstantTuningVCOPTR
=
kHzVX
V
Hz
PTR 110100 ==