
User`s guide
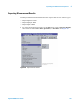


Table Of Contents
- Title Page
- Contents
- Getting Started
- Introduction and Measurement
- Phase Noise Basics
- Expanding Your Measurement Experience
- Starting the Measurement Software
- Using the Asset Manager
- Using the Server Hardware Connections to Specify the Source
- Setting GPIB Addresses
- Testing the 8663A Internal/External 10 MHz
- Testing the 8644B Internal/External 10 MHz
- Viewing Markers
- Omitting Spurs
- Displaying the Parameter Summary
- Exporting Measurement Results
- Absolute Measurement Fundamentals
- Absolute Measurement Examples
- Residual Measurement Fundamentals
- What is Residual Noise?
- Assumptions about Residual Phase Noise Measurements
- Calibrating the Measurement
- Measurement Difficulties
- Residual Measurement Examples
- FM Discriminator Fundamentals
- FM Discriminator Measurement Examples
- AM Noise Measurement Fundamentals
- AM Noise Measurement Examples
- Baseband Noise Measurement Examples
- Evaluating Your Measurement Results
- Advanced Software Features
- Reference Graphs and Tables
- Approximate System Noise Floor vs. R Port Signal Level
- Phase Noise Floor and Region of Validity
- Phase Noise Level of Various Agilent Sources
- Increase in Measured Noise as Ref Source Approaches DUT Noise
- Approximate Sensitivity of Delay Line Discriminator
- AM Calibration
- Voltage Controlled Source Tuning Requirements
- Tune Range of VCO for Center Voltage
- Peak Tuning Range Required by Noise Level
- Phase Lock Loop Bandwidth vs. Peak Tuning Range
- Noise Floor Limits Due to Peak Tuning Range
- Tuning Characteristics of Various VCO Source Options
- 8643A Frequency Limits
- 8644B Frequency Limits
- 8664A Frequency Limits
- 8665A Frequency Limits
- 8665B Frequency Limits
- System Specifications
- System Interconnections
- PC Components Installation
- Overview
- Step 1: Uninstall the current version of Agilent Technologies IO libraries
- Step 2: Uninstall all National Instruments products.
- Step 3: Install the National Instruments VXI software.
- Step 4: Install the National Instruments VISA runtime.
- Step 5: Install software for the NI Data Acquisition Software.
- Step 6: Hardware Installation
- Step 7. Finalize National Instruments Software Installation.
- Step 8: System Interconnections
- Step 9: Install Microsoft Visual C++ 2008 Redistributable Package use default settings
- Step 10: Install the Agilent I/O Libraries
- Step 11: Install the E5500 Phase Noise Measurement software.
- Step 12: Asset Configuration
- Step 13: License Key for the Phase Noise Test Set
- Overview
- PC Digitizer Performance Verification
- Preventive Maintenance
- Service, Support, and Safety Information
- Safety and Regulatory Information
- Safety summary
- Equipment Installation
- Environmental conditions
- Before applying power
- Ground the instrument or system
- Fuses and Circuit Breakers
- Maintenance
- Safety symbols and instrument markings
- Regulatory Compliance
- Declaration of Conformity
- Compliance with German noise requirements
- Compliance with Canadian EMC requirements
- Service and Support
- Return Procedure
- Safety and Regulatory Information
108 Agilent E5505A User’s Guide
5
Absolute Measurement Fundamentals
enough together to create a beatnote that is within the system’s Capture
Range. Once the loop is locked, the frequency of the beatnote must remain
within the drift tracking range for the duration of the measurement. In
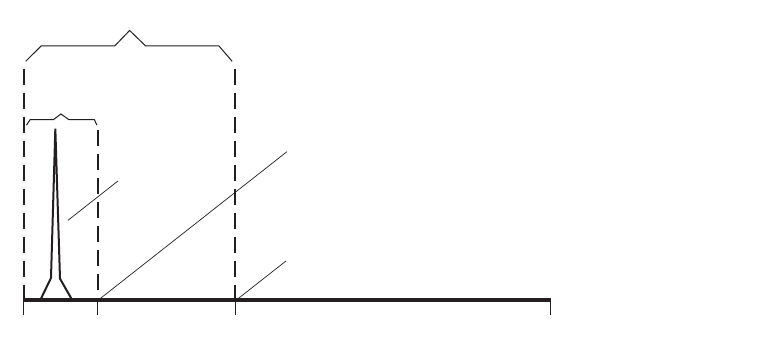
Figure 72, the ranges calculated in the previous example are marked to show
their relationship to the beatnote frequency.
If the beatnote does not remain within the drift tracking range during the
measurement, the out of lock detector is set and the System stops the
measurement. If this happens, you need to increase the system’s drift tracking
range by increasing the system’s peak tuning range (if possible) or by selecting
a VCO source with a greater tuning range.
Selecting the VCO source
Although you must select a VCO source that provides a sufficient tuning range
to permit the system to track the beatnote, keep in mind that a wide tuning
range typically means a higher noise level on the VCO source signal. When the
VCO source for your measurement is also the reference source, this trade-off
can make reference source selection the most critical aspect of your
measurement setup.
Specifying your VCO source
When you set up your PLL measurement, you need to know four things about
the tuning characteristics of the VCO source you are using. The System
determines the VCO source’s peak tuning range from these four parameters.
• Tuning Constant, estimated tuning sensitivity (Hz/V)
• Center Voltage of Tuning Range, (V)
• Tune Range of VCO, (±V)
Figure 72 Capture and drift-tracking ranges and beatnote frequency
Drift tracking range
Capture
range
0 Hz 50 Hz 240 Hz 1000 Hz
5% of the PTR
24% of the PTR
Beatnote