
User`s guide


Table Of Contents
- Title Page
- Contents
- Getting Started
- Introduction and Measurement
- Phase Noise Basics
- Expanding Your Measurement Experience
- Starting the Measurement Software
- Using the Asset Manager
- Using the Server Hardware Connections to Specify the Source
- Setting GPIB Addresses
- Testing the 8663A Internal/External 10 MHz
- Testing the 8644B Internal/External 10 MHz
- Viewing Markers
- Omitting Spurs
- Displaying the Parameter Summary
- Exporting Measurement Results
- Absolute Measurement Fundamentals
- Absolute Measurement Examples
- Residual Measurement Fundamentals
- What is Residual Noise?
- Assumptions about Residual Phase Noise Measurements
- Calibrating the Measurement
- Measurement Difficulties
- Residual Measurement Examples
- FM Discriminator Fundamentals
- FM Discriminator Measurement Examples
- AM Noise Measurement Fundamentals
- AM Noise Measurement Examples
- Baseband Noise Measurement Examples
- Evaluating Your Measurement Results
- Advanced Software Features
- Reference Graphs and Tables
- Approximate System Noise Floor vs. R Port Signal Level
- Phase Noise Floor and Region of Validity
- Phase Noise Level of Various Agilent Sources
- Increase in Measured Noise as Ref Source Approaches DUT Noise
- Approximate Sensitivity of Delay Line Discriminator
- AM Calibration
- Voltage Controlled Source Tuning Requirements
- Tune Range of VCO for Center Voltage
- Peak Tuning Range Required by Noise Level
- Phase Lock Loop Bandwidth vs. Peak Tuning Range
- Noise Floor Limits Due to Peak Tuning Range
- Tuning Characteristics of Various VCO Source Options
- 8643A Frequency Limits
- 8644B Frequency Limits
- 8664A Frequency Limits
- 8665A Frequency Limits
- 8665B Frequency Limits
- System Specifications
- System Interconnections
- PC Components Installation
- Overview
- Step 1: Uninstall the current version of Agilent Technologies IO libraries
- Step 2: Uninstall all National Instruments products.
- Step 3: Install the National Instruments VXI software.
- Step 4: Install the National Instruments VISA runtime.
- Step 5: Install software for the NI Data Acquisition Software.
- Step 6: Hardware Installation
- Step 7. Finalize National Instruments Software Installation.
- Step 8: System Interconnections
- Step 9: Install Microsoft Visual C++ 2008 Redistributable Package use default settings
- Step 10: Install the Agilent I/O Libraries
- Step 11: Install the E5500 Phase Noise Measurement software.
- Step 12: Asset Configuration
- Step 13: License Key for the Phase Noise Test Set
- Overview
- PC Digitizer Performance Verification
- Preventive Maintenance
- Service, Support, and Safety Information
- Safety and Regulatory Information
- Safety summary
- Equipment Installation
- Environmental conditions
- Before applying power
- Ground the instrument or system
- Fuses and Circuit Breakers
- Maintenance
- Safety symbols and instrument markings
- Regulatory Compliance
- Declaration of Conformity
- Compliance with German noise requirements
- Compliance with Canadian EMC requirements
- Service and Support
- Return Procedure
- Safety and Regulatory Information
Absolute Measurement Fundamentals
5
Agilent E5505A User’s Guide 107
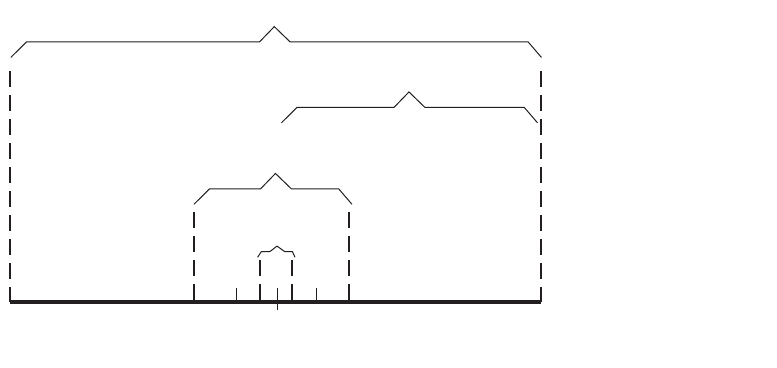
The system’s peak tuning range is derived from the tuning characteristics of
the VCO source you are using for the measurement. Figure 71 illustrates the
relationship that typically exists between the VCO’s peak-to-peak tuning range
and the tuning range of the system.
The system’s drift tracking range is limited to a small portion of the peak
tuning range to minimize the possibility of measurement accuracy degradation
caused by non-linearity across the VCO’s tuning range.
Peak tune range (PTR)
PTR is determined using two parameters:
• VCO tuning sensitivity (Hz/Volt)
• Total voltage tuning range (Volts)
PTR = (VCO Tuning Sensitivity) X (Total Voltage Tuning Range)
PTR = (100 Hz/V) X (10 V) = 1000 Hz
As an Example:
A Peak Tuning Range of 1000 Hz provides the following ranges:
Capture Range = 0.05 X 1000 Hz = 50 Hz
Drift Tracking Range = 0.24 X 1000 Hz = 240 Hz
Tuning requirements
The peak tuning range required for your measurement depends on the
frequency stability of the two sources you are using. The signals from the two
sources are mixed in the system’s phase detector to create a beatnote. In order
for the loop to acquire lock, the center frequencies of the sources must be close
Figure 71 Capture and drift-tracking range with tuning range of VCO
Total peak-to-peak tuning range of VCO
System
peak tuning range
Drift
tracking range
Capture
range
VCO Source center frequency
24% 24%
5% 5%
E5505a_capt_drift_trk_range
26 Feb 04 rev 1