
User`s guide


Table Of Contents
- Title Page
- Contents
- Getting Started
- Introduction and Measurement
- Phase Noise Basics
- Expanding Your Measurement Experience
- Starting the Measurement Software
- Using the Asset Manager
- Using the Server Hardware Connections to Specify the Source
- Setting GPIB Addresses
- Testing the 8663A Internal/External 10 MHz
- Testing the 8644B Internal/External 10 MHz
- Viewing Markers
- Omitting Spurs
- Displaying the Parameter Summary
- Exporting Measurement Results
- Absolute Measurement Fundamentals
- Absolute Measurement Examples
- Residual Measurement Fundamentals
- What is Residual Noise?
- Assumptions about Residual Phase Noise Measurements
- Calibrating the Measurement
- Measurement Difficulties
- Residual Measurement Examples
- FM Discriminator Fundamentals
- FM Discriminator Measurement Examples
- AM Noise Measurement Fundamentals
- AM Noise Measurement Examples
- Baseband Noise Measurement Examples
- Evaluating Your Measurement Results
- Advanced Software Features
- Reference Graphs and Tables
- Approximate System Noise Floor vs. R Port Signal Level
- Phase Noise Floor and Region of Validity
- Phase Noise Level of Various Agilent Sources
- Increase in Measured Noise as Ref Source Approaches DUT Noise
- Approximate Sensitivity of Delay Line Discriminator
- AM Calibration
- Voltage Controlled Source Tuning Requirements
- Tune Range of VCO for Center Voltage
- Peak Tuning Range Required by Noise Level
- Phase Lock Loop Bandwidth vs. Peak Tuning Range
- Noise Floor Limits Due to Peak Tuning Range
- Tuning Characteristics of Various VCO Source Options
- 8643A Frequency Limits
- 8644B Frequency Limits
- 8664A Frequency Limits
- 8665A Frequency Limits
- 8665B Frequency Limits
- System Specifications
- System Interconnections
- PC Components Installation
- Overview
- Step 1: Uninstall the current version of Agilent Technologies IO libraries
- Step 2: Uninstall all National Instruments products.
- Step 3: Install the National Instruments VXI software.
- Step 4: Install the National Instruments VISA runtime.
- Step 5: Install software for the NI Data Acquisition Software.
- Step 6: Hardware Installation
- Step 7. Finalize National Instruments Software Installation.
- Step 8: System Interconnections
- Step 9: Install Microsoft Visual C++ 2008 Redistributable Package use default settings
- Step 10: Install the Agilent I/O Libraries
- Step 11: Install the E5500 Phase Noise Measurement software.
- Step 12: Asset Configuration
- Step 13: License Key for the Phase Noise Test Set
- Overview
- PC Digitizer Performance Verification
- Preventive Maintenance
- Service, Support, and Safety Information
- Safety and Regulatory Information
- Safety summary
- Equipment Installation
- Environmental conditions
- Before applying power
- Ground the instrument or system
- Fuses and Circuit Breakers
- Maintenance
- Safety symbols and instrument markings
- Regulatory Compliance
- Declaration of Conformity
- Compliance with German noise requirements
- Compliance with Canadian EMC requirements
- Service and Support
- Return Procedure
- Safety and Regulatory Information
106 Agilent E5505A User’s Guide
5
Absolute Measurement Fundamentals
The Phase-Lock-Loop Technique
The phase lock loop measurement technique requires two signal sources; the
source-under-test and a reference source. This measurement type requires that
one of the two sources is a voltage-controlled-oscillator (VCO).
You will most likely use the phase lock loop technique since it is the
measurement type most commonly used for measuring signal source devices.
This chapter focuses on this measurement type for signal source
measurements.
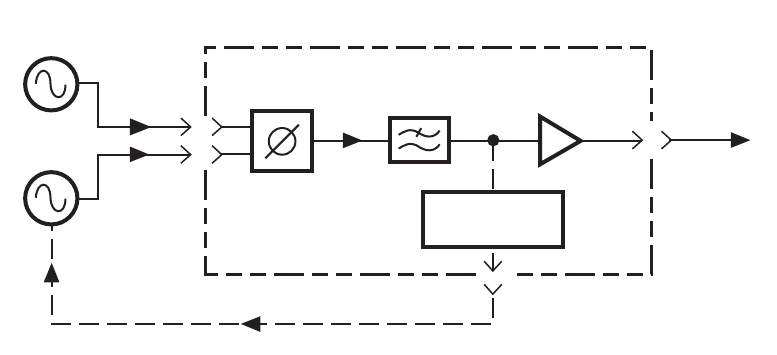
Understanding the Phase-Lock-Loop Technique
This measurement technique requires two signal sources set up in a phase
locked loop (PLL) configuration. One of the sources is the DUT. The second
source serves as the reference against which the DUT is measured. (One of the
two sources must be a VCO source capable of being frequency tuned by the
System.) Figure 70 shows a simplified diagram of the PLL configuration used
for the measurement.
The Phase-Lock-Loop Circuit
The Capture and Drift tracking ranges
Like other PLL circuits, the phase lock loop created for the measurement has a
Capture Range and a drift tracking range. The Capture Range is equal to 5% of
the system’s peak tuning range, and the drift tracking range is equal to 24% of
the system’s peak tuning range.
Figure 70 Simplified block diagram of the phase lock loop configuration
Phase
detector
inputs
Phase
detector
output
Phase
detector
Low-pass
filter
Low-noise
amplifier
Tune voltage
output
Untuned
source
VCO
source
Phase lock
loop control
E5505a_phase_lock_loop
25 Feb 04 rev 1