
Operating instructions


University of Saskatchewan
Electrical Engineering Laboratory Equipment Manual
Spectrum Analyzer
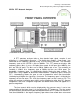
There is only one type of analog spectrum analyzer available for use in the
laboratories. It is the HP 3580A Spectrum Analyzer. This spectrum analyzer is limited
in its maximum frequency—only 50 kHz. However, it has some nice features and is an
excellent teaching aid in that once you understand how to operate this particular
spectrum analyzer, you will know how to operate any other spectrum analyzer.
A spectrum analyzer, as the name suggests, is simply a tool that allows you to
examine a signal in terms of its frequency components. That is, it displays signal
amplitude as a function of frequency. Exactly how it does this is surprisingly easy to
understand.
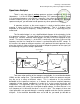
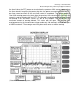
The illustration below is a very simplified block diagram of the electronics inside
of a spectrum analyzer. The input signal passes through a bandpass filter (BPF), then
through to a sensitive voltmeter which controls the level of the line displayed on the
screen. The center frequency, f
o
, of the BPF is continually swept from a low to a high
frequency and the line sweep on the screen is synchronized with the BPF sweep. In
this manner, the spectrum analyzer examines a tiny portion of the total spectrum at any
given time, and thus yields a picture of the total or composite spectrum of the signal you
are examining every time a sweep is performed.
Two more major qualities of the sweep are controllable: the resolution bandwidth
(RBW) and the sweep time. The bandwidth of the BPF within the spectrum analyzer
may be set to a variety of different values. This is referred to as the resolution
bandwidth of the spectrum analyzer, as it dictates the minimum required frequency
separation of two spectral components in order for it to just resolve two those two
components. For argument’s sake, say you set up two different signal generators to
output sine waves with exactly the same peak-to-peak voltage. Assume that one is set
to a frequency of 1.0 kHz and the other is set to 1.3 kHz. The outputs of these two
signal generators are passed through a summing amplifier and then into the spectrum
analyzer. If the resolution bandwidth were set to 300 Hz, you would just be able to
BPF
RBW
f
o
V
DISPLAY
SYNCHRONIZED
Amplitude
Frequency
Amplitude
Frequency
Signal In
Spectrum Analyzer