
Technical data


Table Of Contents
- Agilent 3000 Series Oscilloscopes-At a Glance
- In This Book
- Contents
- Figures
- Tables
- Getting Started
- Step 1. Inspect the package contents
- Step 2. Turn on the oscilloscope
- Step 3. Load the default oscilloscope setup
- Step 4. Input a waveform
- Step 5. Become familiar with the Front Panel Controls
- Step 6. Become familiar with the oscilloscope display
- Step 7. Use Auto-Scale
- Step 8. Compensate probes
- Step 9. Use the Run Control buttons
- Displaying Data
- Capturing Data
- Making Measurements
- Saving, Recalling, and Printing Data
- Oscilloscope Utility Settings
- Specifications and Characteristics
- Service
- Safety Notices
- Index
2 Displaying Data
58 Agilent 3000 Series Oscilloscopes User’s Guide
Changing the Display Settings
To display waveforms as vectors or dots
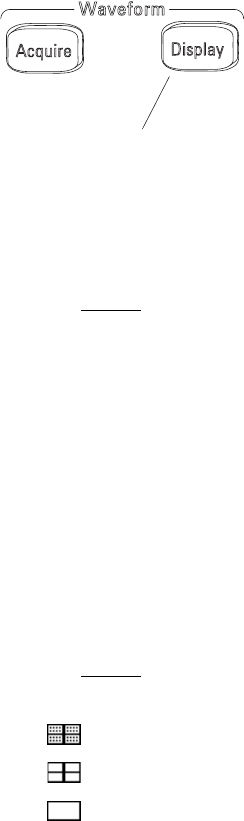
1 Press Display.
2 In the Display menu, select Typ e to toggle the waveform display
between:
• Vectors — the oscilloscope connects the sample points by using digital
interpolation.
Digital interpolation maintains linearity by using a sin(x)/x digital
filter. The digital interpolation is suitable for real time sampling and
is most effective at 20 ns or faster horizontal scale settings.
• Dots — the sample points are displayed.
To change the grid
1 Press Display.
2 In the Display menu, press Grid to select between:
• — display grid and coordinates on the axes.
• — displays coordinates on the axes.
• — turns off the grid and coordinates.
Figure 26 Display Button