
Technical data


Table Of Contents
- Agilent 3000 Series Oscilloscopes-At a Glance
- In This Book
- Contents
- Figures
- Tables
- Getting Started
- Step 1. Inspect the package contents
- Step 2. Turn on the oscilloscope
- Step 3. Load the default oscilloscope setup
- Step 4. Input a waveform
- Step 5. Become familiar with the Front Panel Controls
- Step 6. Become familiar with the oscilloscope display
- Step 7. Use Auto-Scale
- Step 8. Compensate probes
- Step 9. Use the Run Control buttons
- Displaying Data
- Capturing Data
- Making Measurements
- Saving, Recalling, and Printing Data
- Oscilloscope Utility Settings
- Specifications and Characteristics
- Service
- Safety Notices
- Index
Displaying Data 2
Agilent 3000 Series Oscilloscopes User’s Guide 41
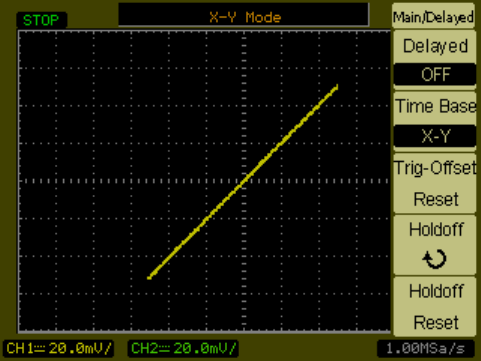
X-Y Format
This format compares the voltage level of two waveforms point by point. It
is useful for studying phase relationships between two waveforms. This
format only applies to channels 1 and 2. Choosing the X-Y display format
displays channel 1 on the horizontal axis and channel 2 on the vertical
axis.
The oscilloscope uses the untriggered sample acquisition mode and
waveform data is displayed as dots. The sample rate can vary from
4 kSa/s to 100 MSa/s, and the default sample rate is 1 MSa/s.
The following modes or functions are not available in X-Y format:
• Automatic voltage or time measurements.
• Cursor measurements.
• Mask testing.
• Math function waveforms.
• Reference waveforms.
• Delayed sweep time base display.
• Displaying waveforms as vectors.
Figure 13 X-Y Display Format Showing In-Phase Waveforms