
User`s manual


Other productivity tools (continued)
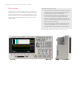
Keysight Spectrum Visualizer (ASV) software
This PC-based software package connects to the scope
via USB or ethernet connection and uses the Keysight
I/O libraries to communicate. It provides advanced FFT
frequency domain analysis at a cost-effective price as well
as spectrum and spectrogram analysis with an intuitive user
interface that RF engineers are familiar with.
Tools include:
Spectrum measurements
– Power (dBm) vs. frequency
– Horizontal (x-axis): Specify center frequency and
frequency span, or start and stop frequencies
– Vertical (y-axis): Specify reference level (dBm) and
scale (dB/div)
– Settable resolution bandwidth
– Flat top, Gaussian, or Hanning windows applied to the
time domain data for the FFT analysis
– Marker to peak amplitude, and marker to center
frequency.
– Marker peak search can be enabled for time-varying
signals
– Multiple marker, with delta X and delta Y readouts
Acquisition and display modes
– Free Run (continuous ), Triggered, Stop, Single, Preset
– Triggered mode: specify trigger power level (dBm),
single or continuous sweep
– Enable/disable y-axis label
– Enable/disable main trace display
– Max hold display mode
– Gated Measurements
– Multiple viewing options
- Spectrogram
- waterfall
- 3D
– Changeable scaling settings on main window
– Local language support
– Multiple oscilloscopes can be congured to allow user
to rapidly switch between multiple instruments
Arbitrary waveform generator source control
– 20 MHz sine wave
– 10 MHz square wave
– Pulsed waveform
– WaveGen source settings can be altered while ASV
is running for interactive signal source and analysis
capability
Waterfall View for ASV Spectrogram Measurement
Close-Up Detail on Frequency Shift Keying (FSK) Characteristics
with the ASV Spectrogram Measurement
10 | Keysight | InniiVision 2000 X-Series Oscilloscopes - Data Sheet