6700 Series Logic Analysis System Product Overview Debugging today's digital systems is tougher than ever. Increased product requirements, complex software, and innovative hardware technologies make it difficult to meet your time-to-market goals.
Table of Contents 2 System Overview Modular Design Features and Benefits Selecting the Right System page 3 page 4 page 6 Mainframes Display Back Panel System Screens IntuiLink page 7 page 8 page 9 page 12 Probing Solutions Criteria for Selection Technologies page 13 page 14 Data Acquisition and Stimulus State/Timing Modules Oscilloscope Modules Pattern Generation Modules Emulation Modules page 17 page 30 page 33 page 37 Post-Processing and Analysis Tool Sets Software Tool Sets Source Correlation D
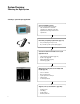
System Overview Modular Design Modular Design Protects Your Long-Term Investment Modularity is the key to the Agilent 16700 Series logic analysis systems' long term value. You purchase only the capability you need now, then expand as your needs evolve. All modules are tightly integrated to provide time-correlated, cross domain measurements.
System Overview Features and Benefits System Capability NEW Touch Screen Interface The Agilent 16702B mainframe supports a large, 12.1 inch LCD touch screen and redesigned front panel controls for an easy-to-operate, self-contained unit requiring minimal bench space and offering simple portability. NEW Multiframe Configuration By connecting up to eight mainframes and expanders you can simultaneously view time-correlated traces for all buses in a large channel count, multibus system.
System Overview Features and Benefits Data Transfer, Documentation, and Remote Programming Direct Link to Microsoft® Excel via Agilent IntuiLink • Automatically move your data from the logic analyzer into Microsoft Excel with just a click of the mouse. (See page 12) • Use Microsoft Excel’s powerful functions to post-process captured trace data to get the insight you need.
System Overview Selecting the Right System Selecting a system for your application Select a mainframe (page 7) Choose a system based on your needs: • Self-contained unit or a unit with external mouse, keyboard, and monitor • Expander frame for large channel count requirements Determine your probing requirements (page 13) • Are you analyzing a microprocessor? • Do you need to probe a specific package type? Select the measurement modules to meet your application needs • • • • State/Timing Logic Analyzers
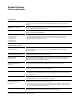
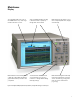
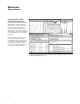
Mainframes Display 12.1" LCD display with touch screen on the 16702B makes it easy to view a large number of waveforms or states. Select a modifiable variable by touching it, then turn the knob to quickly step through values for the variable. Dedicated hot keys give instant access to the most frequently used menus, displays, and on-line help. Dedicated knobs for horizontal and vertical scaling and scrolling. Adjust the display to get just the information you need to solve your problem.
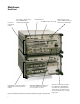
Mainframes Back Panel Five slots for measurement modules Connection for optional monitor. (Up to 1600x1200 video resolution with option 003) Expander frame connection provides an additional five slots for measurement modules. Parallel printer port 10/100BaseT LAN - autosensing Built-in 40x CD-ROM drive makes it easy to install or update system software, processor support, or tool sets. Figure 2.2. The mainframe and expander frame provide advanced capabilities for debugging complex target systems.
Mainframes System Screens Figure 2.3. Icons in the power-up screen give you quick access to common tasks. System Admin allows you to quickly set up the instrument on your network, configure print servers, set up user accounts for security or install software updates. Setup Assistant is a guided menu system that helps you configure the logic analysis system for your target microprocessor or bus. Online information guides you through the setup. (See figure 2.
Mainframes System Screens See the Big Picture of Your Prototype System's Behavior A large external display (option 001) with multiple, resizable windows allows you to see at a glance more of your target system's operation. A built-in, flat-panel display in the 16702B fits in environments with limited space. Color lets you highlight critical information so you can find it quickly. Use one system to examine target operation from different perspectives.
Mainframes System Screens Expanding Possibilities with Network Connectivity Web-enabled instrumentation gives you the freedom to access the system—anywhere, anytime. Have you ever needed to check on a measurement's status while you were in a remote location? Now you can. With a Web Enabled Logic Analysis System You Can... ...install Agilent IntuiLink to seamlessly transfer data from the system to a PC ...access Agilent's Web site for the latest online manuals and technical information ...
Mainframes IntuiLink Agilent IntuiLink Moves Your Data Automatically into Microsoft® Excel for Advanced Offline Analysis IntuiLink is shipped with each logic analysis system and can be downloaded to your PC from the system’s own web page. Use the Agilent IntuiLink tool bar to connect to a logic analysis system. Select from the available labels and specify the destination cell location in Microsoft Excel. Use Microsoft Excel's powerful functions to post-process captured trace data for the insight you need.
Probing Solutions Criteria for Selection Why is Probing Important? Your debugging tools perform three important tasks: probing your target system, acquiring data, and analyzing data. Data acquisition and analysis tools are only as effective as the physical interface to your target system. Use the following criteria to see how your probing measures up.
Probing Solutions Technologies Choose the Optimum Probing Strategy for Your Application NEW Figure 3.3. The E5382A single-ended flying lead probe set provides connections for 17 channels of the 16760A logic analyzer. Connecting to individual test points with flying leads Figure 3.4. Surface mount IC clip. 5090-4356 (20 clips). Figure 3.2. Figure 3.5. 0.5 mm IC clip. 10467-68701 (4 clips). Advantages Limitations Most flexible method.
Probing Solutions Technologies Designing connectors into the target system Figure 3.8. Advantages Limitations Very reliable connections. Saves time in making multiple connections. Requires advance planning in the design stage. Requires some dedicated board space. Moderate incremental cost.
Probing Solutions Technologies Using a processor- or bus-specific analysis probe Figure 3.10. Advantages Limitations Easiest and fastest connection to supported processors and buses. Moderate to significant incremental cost. Only useable for the specific processor or bus. May require moderate clearance around processor or bus. 16 Refer to “Processor and Bus Support for Agilent Technologies Logic Analyzers,” publication number 5966-4365E, for specific solutions.
Data Acquisition and Stimulus State/Timing Modules Selecting the Correct Modules to Meet Your Needs Selecting the proper logic analyzer modules for your needs requires a series of choices concerning performance, cost, and the amount of data you will be able to capture. The following table explains these factors in greater detail.
Data Acquisition and Stimulus State/Timing Modules Considerations for Choosing Modules (continued) Channel Count Determine the number of signals you want to analyze on your system under test. You will need this number of channels in your logic analyzer. Even if you have enough channels to view all the signals in your system today, you should consider logic analysis systems that allow you to add more channels for your future application needs.
Data Acquisition and Stimulus State/Timing Modules Key Features of Agilent’s State/Timing Modules • Memory depth up to 128M samples at a price to meet your budget • State analysis up to 1.
Data Acquisition and Stimulus State/Timing Modules Improve Your Productivity with an Intuitive User Interface Agilent Technologies has made the user interface easy to understand and use. Now you can spend more time making measurements and less time setting up the logic analyzer. Format allows you to group signals into buses. Sampling defines how the logic analyzer will acquire the data. Trigger defines what data is acquired.
Data Acquisition and Stimulus State/Timing Modules VisiTrigger Quickly Locates Your Most Elusive Problems VisiTrigger technology is a breakthrough in logic analysis usability. It combines increased trigger functionality with a user interface that is easy to understand and use. Now with VisiTrigger, capturing complex events is as simple as pointing to the trigger function and filling-in-the-blanks.
Data Acquisition and Stimulus State/Timing Modules VisiTrigger Your most commonly used triggers are just a mouse click away with the built-in trigger functions. VisiTrigger’s graphical representation shows you how the trigger condition will be defined. You can use trigger functions as building blocks to easily customize a trigger for your specific task. View current information on the state of the timers, counters, flags, and the trigger sequence level.
Data Acquisition and Stimulus State/Timing Modules 2 GHz Timing Zoom Provides HighSpeed Timing Analysis Across All Channels, All the Time When you're pushing the speed envelope, you may run into elusive hardware problems. Capturing glitches and verifying that your design meets critical setup/hold times can be difficult without the proper tools. With Timing Zoom you have access to the industry's most powerful tool for high-speed digital debug.
Data Acquisition and Stimulus State/Timing Modules Eye Finder Agilent’s eye finder examines the signals coming from the circuit under test and automatically adjusts the logic analyzer’s setup and hold window on each channel. Eye finder, combined with 100 ps adjustment resolution (10 ps on 16760A) on Agilent’s logic analyzer modules, yields the highest confidence in accurate state measurements on high-speed buses. It takes less than a minute to run eye finder.
Data Acquisition and Stimulus State/Timing Modules Eye Finder as an Analytical Tool Examples of When to Run Eye Finder Eye finder is very useful as a firstpass screening test for data valid windows. Because eye finder quickly examines all channels, it is considerably faster than examining each channel with an oscilloscope. After running eye finder, you may want to use an oscilloscope to examine only those signals that are close to your desired specifications for setup and hold.
Data Acquisition and Stimulus State/Timing Modules Features Supported in Agilent State and Timing Analysis Modules Agilent Module Number 16710A, 16711A, 16712A 16715A 16716A, 16717A, 16740A, 16741A, 16742A, 16750A 16751A, 16752A 16760A Eye finder √ √ √ Visitrigger √ √ √ √ Timing Zoom Transitional timing √ Context Store √ Eye Scan 26 √ √ √ √
Data Acquisition and Stimulus State/Timing Modules Agilent 16760A: Extending Logic Analysis to New Realms • Differential inputs (single-ended probes also available). • State analysis up to 1.5 Gb/s. • Setup-and-hold time of 500 ps. • Input signal amplitude as low as 200 mV p-p. Logic analysis at state speeds up to 1.5 Gb/s imposes a stringent set of criteria for a logic analyzer. • Probing Agilent’s 16760A uses an innovative probing system with only 1.5 pF of probe tip capacitance, including the connector.
Data Acquisition and Stimulus State/Timing Modules Eye scan In the eye scan mode, the Agilent 16760A scans all incoming signals for activity in a time range centered on the clock and over the entire voltage range of the signal. The results are displayed in a graph similar to an eye diagram as seen on an oscilloscope. As timing and voltage margins continue to shrink, confidence in signal integrity becomes an increasingly vital requirement of the design verification process.
Data Acquisition and Stimulus State/Timing Modules Probing solutions to match the measurement capabilities Three probing options are available for the Agilent 16760A. Each probe can be ordered by its individual model number or as an option to the 16760A. The following table indicates both the model number and the option number. Probes are not supplied as part of the standard 16760A. Probes must be ordered separately, either as options to the 16760A or individually by their respective model numbers.
Data Acquisition and Stimulus Oscilloscope Modules When integrated into the 16700 Series logic analysis systems, the oscilloscope modules make powerful measurement and analysis more accessible, so you can find the answers to tough debugging problems in less time. Oscilloscope controls are easy to find and use. Multiple Views of Target Behavior Isolate Problems Quicker Frequently a problem is detected in one measurement domain, while the clues to the cause of the problem are found in another.
Data Acquisition and Stimulus Oscilloscope Modules Automatic Measurements Quickly Characterize Signals Markers Easily Set Up Timing and Voltage Margin Measurements The Agilent Technologies 16534A oscilloscope modules quickly characterize signals with automatic measurements of rise time, voltage, pulse width, and frequency. Four independent voltage markers and two local time markers are available to quickly set up measurements of voltage and timing margins.
Data Acquisition and Stimulus Oscilloscope Modules More Channels When You Need Them You can combine up to four 16534A oscilloscope modules to provide up to eight channels on a single time base. When you operate in this mode, you can use the master module for triggering. External trigger input and output are used to connect up to four oscilloscope modules, providing up to eight channels on a single time base.
Data Acquisition and Stimulus Pattern Generation Modules Digital Stimulus and Response in a Single Instrument Parallel Testing of Subsystems Reduces Time to Market Configure the logic analysis system to provide both stimulus and response in a single instrument. For example, the pattern generator can simulate a circuit initialization sequence and then signal the state or timing analyzer to begin measurements.
Data Acquisition and Stimulus Pattern Generation Modules Vectors Up To 240 Bits Wide Depth Up to 16 MVectors Vectors are defined as a "row" of labeled data values, with each data value from one to 32 bits wide. Each vector is output on the rising edge of the clock. With the 16720A pattern generator, you can load and run up to 16 MVectors of stimulus.
Data Acquisition and Stimulus Pattern Generation Modules Figure 4.8. Stimulus vectors are defined in the Sequence menu tab. In this example, vector output halts until the WAIT UNTIL condition is satisfied. Figure 4.9. To fill the 16720A pattern generator's 8 MVector deep memory (16 MVector in half channel mode) with data, the stimulus must be in 'pattern generator binary' format. Stimulus files in .PGB format can be loaded directly from the user interface.
Data Acquisition and Stimulus Pattern Generation Modules "User Macro" and "Loop" Simplify Creation of Stimulus Programs ASCII Input File Format: Your Design Tool Connection Direct Connection to Your Target System User macros permit you to define a pattern sequence once, then insert the macro by name wherever it is needed. Passing parameters to the macro will allow you to create a more generic macro. For each call to the macro you can specify unique values for the parameters.
Data Acquisition and Stimulus Emulation Modules Speed Problem Solving With Off-the-Shelf Solutions for Many Common Microprocessors To help you design and debug your microprocessor-based target systems, Agilent offers different microprocessor specific products that let you get control and visibility over your microprocessor’s internal and external data. An analysis probe allows you to quickly connect an Agilent logic analyzer to your target system.
Data Acquisition and Stimulus Emulation Modules Emulation Control Interface The emulation control interface is accessed from the power up screen of the Agilent 16700 Series system. The interface is included with the Agilent E5901A/B emulation modules. Designed for hardware engineers, this graphical user interface provides the following features: • Control over processor execution: run/break/reset/step. • Register display/modification.
Post-Processing and Analysis Tool Sets Software Tool Sets Once the data is acquired, you can rely on the post-processing tools to rapidly consolidate data into displays that provide insight into your system's behavior. The tool sets described in the following pages are optional, post-processing software packages for the 16700 Series logic analysis systems. Selecting the Right Tool Set Take a look at the tool set descriptions below to see if they meet your needs.
Post-Processing and Analysis Tool Sets Software Tool Sets Free Tool Set Evaluation To see which tool sets best fit your needs, Agilent Technologies offers a free 21-day trial period that lets you evaluate any tool set as your work schedule permits. Once you receive your tool, you obtain a password that temporarily enables the tool. Figure 5.1. For a free, one-time, 21-day trial of any tool set, simply type “demo” in the password field for the product you want to evaluate.
Post-Processing and Analysis Tool Sets Source Correlation Debug Your Source Code The Agilent B4620B source correlation tool set correlates a microprocessor execution trace window with a corresponding high-level source code window. The source correlation tool set enhances your software development environment by providing multiple views of code execution and variable content under severe realtime constraints.
Post-Processing and Analysis Tool Sets Source Correlation When You Want to Trace . . . ...on a variable to see what caused data corruption. ...on a function to determine where it is being called from in order to understand the context of a system error. ...on a line number to determine if a specific code segment is ever executed. Simply Click . . . ... to trace about a variable, function, or line number. ... to halt processor execution with an integrated emulation module when the trace event occurs. ...
Post-Processing and Analysis Tool Sets Source Correlation Once You Acquire the Trace . . . ...“step” through the trace at the sourcecode level or the assembly level. Locate the cause of a problem by “stepping backward” from the point where you see a problem to its root cause. ...quickly locate a specific function, variable, or text string. The system maintains a history of previous text searches for quick recall. ...click the source line which you want to trace about on your next acquisition. ...
Post-Processing and Analysis Tool Sets Source Correlation Product Characteristics Data Sources All state and timing measurement modules supported by the 16700 Series logic analysis systems (except the 16517A/518A) serve as data sources for the source correlation tool set.
Post-Processing and Analysis Tool Sets Data Communications Monitor Packet Information on Parallel Data Buses The data communications tool set shows parallel bus data at a protocol level on the logic analyzer. Developers have the capability to find complex, system-level bus interaction problems in applications such as a switching or routing system.
Post-Processing and Analysis Tool Sets Data Communications Theory of Operation Use a logic analyzer to probe the system’s parallel data buses (e.g., UTOPIA). UTOPIA Level 2 CPU Custom/UTOPIA The analyzer needs access to: • • • • Data signals Qualifying signals Start of cell or packet bit Synchronous clock for the bus The synchronous bus clock samples data into the logic analyzer. Qualifiers such as "Data Valid" allow the logic analyzer to sample only on events of interest instead of all cycles.
Post-Processing and Analysis Tool Sets Data Communications Product Characteristics Additional Information Requires 16700 Series logic analysis system with system software version A.01.50.00 or higher Applications Trigger on a processor event and see what is happening on a parallel data bus with protocol information or vice versa.
Post-Processing and Analysis Tool Sets Data Communications Edit or create a protocol using the logic analyzer user interface. Select a known protocol and add proprietary fields. Insert custom wrapper or field here. Insert name, number of bits and format for trigger and display. Define any symbols for both trigger and display of packets. Edit or create a protocol using a text file. Start with standard protocol definition and add custom fields with text file. Insert protocol layer name.
Post-Processing and Analysis Tool Sets Data Communications New packet trigger macros. Choose from a list of buses. Trigger on simple IP address instead of setting up trigger sequencer. Specify what action to perform once a packet is found. Specify protocol layer to trigger on. Use any defined protocol fields as a trigger, such as source address, destination address, etc. Physical representation of bit fields to be triggered on. This window is automatically updated when fields are edited. Figure 5.7.
Post-Processing and Analysis Tool Sets Data Communications Use the bus editor feature to specify what protocol runs on your bus. This is helpful when probing more than one bus with a single state/timing module. Figure 5.8.
Post-Processing and Analysis Tool Sets Data Communications Protocol Filters and Viewing Preferences Filter captured data to only view key data for measurement. Choose to view payload data with header information. Select which protocol layers and fields to view in trace. Figure 5.9.
Post-Processing and Analysis Tool Sets Data Communications Display of protocol levels. Protocol view of data acquired in logic analyzer. Figure 5.10. Time tags for system level correlation of other data buses, memory interfaces, microprocessors, etc.
Post-Processing and Analysis Tool Sets Data Communications Global markers measure time intervals between packets on separate parallel interfaces or timing between the data path and a microprocessor. Collapsed view of protocol information using preferences. Raw packet header information. Raw payload information. Figure 5.11.
Post-Processing and Analysis Tool Sets System Performance Analysis Optimize System Performance Your design has to meet consistent performance requirements over a range of operating conditions and over a specific time period. Using the system performance analysis tool set, you can obtain answers to many of your questions concerning performance and responsiveness, software execution coverage, debug and system parameter analysis, etc.
Post-Processing and Analysis Tool Sets System Performance Analysis Product Characteristics SPA Tools State Interval Display Time Interval Display Time Overview Display State Overview Display Generates Statistical representations of the captured data Shows the amount and percent of time spent in each of the targeted functions or data locations. Provides Histogram of event activity. Display shows the percentage of hits for each procedure, function, or event (states).
Post-Processing and Analysis Tool Sets System Performance Analysis Product Characteristics (continued) SPA Tools State Interval Display Time Interval Display Time Overview Display State Overview Display Number of hits State bucket width Supplemental Information Number of hits Minimum time Maximum time Average time Standard deviation Number of hits Time bucket width Display Modes Sort by number of hits Sort alphabetically by event name Sort by time Sort alphabetically by event name Autoscale zoom
Post-Processing and Analysis Tool Sets System Performance Analysis State Overview Tool Narrow in on an area of interest using built-in qualification and zoom functions. Pinpoint regions of high memory activity to determine which routines or operations are responsible for throughput bottlenecks. Measure memory coverage or stack usage by observing whether memory locations are accessed. You can also detect which peripherals are most frequently used. Figure 5.12.
Post-Processing and Analysis System Performance Analysis State Interval Tool Sort and display symbols alphabetically by event name or by the number of hits. Display just the symbols you want to evaluate by using the symbol-navigation utility. The utility automatically configures the tool for the selected function and variable names from large symbol files created by complex software projects. To help simplify your display, delete all functions below a selected point with a single mouse click.
Post-Processing and Analysis System Performance Analysis Time Interval Tool Because time interval measurements often depend upon hardware-software interaction, the event definition can be a combination of symbolics and hardware events. Data qualification can be used to define the specific hardware context in which the analysis will be made. Data is displayed in histograms, which can be exported to your host computer either as histograms or as tabular formatted text files.
Post-Processing and Analysis Tool Sets System Performance Analysis Time Overview Tool Use “Comments” to document your trace. The “Comments” field contents are saved with the configuration and data. Use the markers in this window to correlate interrupts to a state listing or timing waveform. Elusive system crashes are often caused by too many interrupts occurring over a short period of time.
Post-Processing and Analysis Tool Sets Serial Analysis Solve Serial Communication Problems Product Description Your system may use serial buses to communicate between ICs and to transfer data to and from peripheral devices. Sifting through thousands of serial bits by looking at long vertical columns of captured 1's and 0's can be very tedious, time-consuming, and error-prone.
Post-Processing and Analysis Tool Sets Serial Analysis When You Want to Analyze Serial Bit Streams . . . ...specify which signal you want to convert to parallel format by selecting a specific bit of any available label. ...accept the default output label“Parallel” or modify the label name for easy recognition. ...set the output parallel word width (up to 32 bits). ...select the specific state in the trace where conversion begins. ...
Post-Processing and Analysis Tool Sets Serial Analysis To Separate Frame Information from the Data Block . . . ...accept the default start of frame label “Start” or modify the label to a name of your choosing. ...specify the pattern that designates the start of a frame. ...get immediate feedback as you configure the tool set for your data. This diagram changes as you make your framing and data block selections. ...
Post-Processing and Analysis Tool Sets Serial Analysis To Acquire a Serial Bit Stream without an External Clock Reference . . . ...set the sample period of your timing analyzer to take four or more samples for each serial bit. ...accept the “Samples” default label or enter a new label name. ...specify the embedded bit time of the serial bit stream. ...specify the incoming signal’s data encoding method, normal or NRZI. Figure 5.18. Clock Recovery Algorithm 1.
Post-Processing and Analysis Tool Sets Serial Analysis Once the Serial Bit Stream is Acquired . . . This example shows the conversion of an RS232 serial bit stream. The data sent to the printer includes the column header ”MACHINE”. ...configure the serial tool once for your specific bus, then save the configuration for future uses. ...view the serial-to-parallel conversion in the format that is easiest for you — waveform or listing. ...
Post-Processing and Analysis Tool Sets Serial Analysis Product Characteristics Data Sources All state and timing measurement modules supported by the 16700 Series logic analysis systems serve without modification as data sources for the B4601B serial analysis tool set. The particular measurement module used determines time resolution and accuracy. Sample rate, channel count, memory depth and triggering are controlled by the user independent of the serial analysis tool.
Post-Processing and Analysis Tool Sets Tool Development Kit Customize Your Measurements The ability to interpret and display information is vital to your project. At times the information you need can be buried in the raw data of your measurement.
Post-Processing and Analysis Tool Sets Tool Development Kit Custom Tool Example, Added Text in Trace This example shows how a custom tool can convert data to text to present information in an easy-to-understand form. The original trace comes from a control unit in an automobile. Embedded in the data is information about the engine and transmission. When MODE = 0, DATA represents engine information, including RPM, fuel level, fuel to air ratio, and manifold pressure.
Post-Processing and Analysis Tool Sets Tool Development Kit Custom Tool Example, Microprocessor Code Reconstruction The original trace came from the bus of a MPC 555 processor. As you can see, no data was placed on the bus at the time of the trace because cache memory was turned on. Normally, it would not be possible to inverse assemble this trace. Original Trace The output of the custom tool in this example is shown. Notice that there is now data in the DATA column.
Post-Processing and Analysis Tool Sets Tool Development Kit Custom Tool Example, Multiplex Data Custom tools can combine several lines of data acquired sequentially under one label into one line of data. However the data to be combined does not have to come from the same label, it can come from different labels. The labels can even come from different analyzers. Output of Custom Tool Original Trace At left are the parameter window and message display created by the custom tool in this example.
Post-Processing and Analysis Tool Sets Tool Development Kit Custom Tool Development Environment Select this button to cause the compiled code to operate on the acquired data. This is the main window for developing code with the tool development kit. Select this button to compile the code displayed in the “Source Code” tab. Load a file created on another system or create your code here using the “Source Code” editor. Compilation status is shown at the bottom of the tool development kit Display window.
Post-Processing and Analysis Tool Sets Tool Development Kit Product Characteristics Provided Functions Analyzer compatible custom tools will run on any 16700 Series analyzer running version A.01.40.00 or greater. In some rare instances, changes in the operating system can require that your tools be recompiled in order to run on that version of the operating system.
Post-Processing and Analysis Tool Sets Licensing Information Licensing and Miscellaneous Description System Configuration Requirements • 16700 Series logic analysis system • Desired tool set(s) • Supported and compatible measurement hardware Tool Set Control • Locally control and view tool set measurements • Remotely access any tool set from a PC or workstation through a web browser or X-window emulation software.
Time Correlation with Agilent Infiniium Oscilloscopes E5850A Logic Analyzer - Oscilloscope Time Correlation Fixture E5850A Logic Analyzer – Oscilloscope Time Correlation Fixture The Agilent E5850A time correlation fixture allows you to make time-correlated measurements between a 16700 logic analyzer and an Agilent 548XX Series Infiniium oscilloscope to solve the following types of problems more effectively: • Verifying signal integrity • Tracking down problems caused by signal integrity • Verifying correct
Mainframe Specifications and Characteristics Agilent 16700 Series Technical Information Mass Storage Hard Disk Drive 9 GB formatted disk drive System Software Floppy Disk Drive • Capacity • Media • Formats 1.44 MB formatted 3.5 inch floppy MS-D0S (Read, write, format), LIF (Read only) All features and functionality described in this document are available with system software version A.02.20.
Mainframe Specifications and Characteristics Agilent 16700 Series Technical Information (continued) Web Server Supported from Instrument Web Page Measurement status check,remote display, installation of PC application software, link to Agilent’s Test and Measurement site PC Requirements Pentium® (family) PC (200 MHz, 32 MB RAM) running Windows 95, Windows 98, or Windows NT 4.0 with service pack 3 or higher Supported Web Browsers (on Your PC or Workstation) Internet Explorer 4.0 or higher, Netscape 4.
Mainframe Specifications and Characteristics Agilent 16700 Series Technical Information (continued) Port In Levels TTL, ECL, or user defined Input Resistance 4 KΩ Input Voltage –6V at –1.5 mA to +6V at 1.6 mA Port Out Levels 3V TTL compatible into 50 Ω Functions Latched (latch operation is module dependent) Pulsed, width from 66 ns to 143 ns Target Control Port Number of signals 8 Levels 3V TTL compatible Connector 2 rows of 5 pins, 0.
Mainframe Specifications and Characteristics Remote Programming Interface (RPI) RPI Overview Typical Applications Manufacturing Test Data Acquisition for Offline Analysis System Verification and Characterization Pass/Fail Analysis Stimulus Response Tests Remote Programming Steps 1.Set up the logic analyzer and save the test configuration. 2.
Mainframe Specifications and Characteristics Remote Programming Interface (RPI) (continued) Command Set Summary - Commands available on both UNIX and PC System System Configuration Query Load/Save Configuration and Data Start/Stop Measurement Current Run Status Start/Stop/Query a Session Logic Analysis Modules Load/Save Configuration and Data Trigger Setup Acquisition Data and Parameters Set/Query Acquisition Mode Set/Query Acquisition Depth Set/Query Pod Assignment Add/Delete/Load/Query Labels Set/Quer
Mainframe Specifications and Characteristics IntuiLink Programming Examples Provided with IntuiLink Visual Basic Examples have been included for use with Visual Basic 5.0 or higher. These examples perform simple functions such as: system checks, oscilloscope measurements, pass/fail tests using stored configuration and pattern generator stimulus files, and stimulus/response tests. They also can capture and retrieve data for off-line analysis.
Mainframe Specifications and Characteristics Agilent 16700B Series Physical Characteristics 12.1” Built-in LCD Display with Touch Screen 3.5 Inch Floppy Disk Drive Power 16700B 16701B 16702B 115/230 V, 48 to 66 Hz, 610 W max 115/230 V, 48 to 66 Hz, 545 W max 115/230 V, 48 to 66 Hz, 610 W max On/Off Power Switch Touch Screen On/Off Weight* Figure 6.1. Agilent 16702B front panel. 16700B lbs) 16701B lbs) 16702B lbs) Max Net 12.7 kg (27.0 lb) Max Shipping 34.2 kg (75.4 10.4 kg (23.0 lb) 32.0 kg (70.
Mainframe Specifications and Characteristics Agilent 16700A Series Physical Characteristics Built-in LCD Display 3.5 Inch Floppy Disk Drive Power 16700A 16701A 16702A 115/230 V, 48 to 66 Hz, 610 W max 115/230 V, 48 to 66 Hz, 545 W max 115/230 V, 48 to 66 Hz, 610 W max On/Off Power Switch Screen Intensity Adjustment Keypads for Alpha-Numeric Entry Weight* Figure 6.4. Agilent 16702A front panel. 16700A lbs) 16701A lbs) 16702A lbs) Max Net 12.7 kg (27.0 lb) Max Shipping 34.2 kg (75.4 10.4 kg (23.
Probing Solutions Specifications and Characteristics Probing Technical Specifications POWER GND 2 SIGNAL GND 4 SIGNAL GND 6 SIGNAL GND 8 SIGNAL GND 10 SIGNAL GND 12 SIGNAL GND 14 SIGNAL GND 16 SIGNAL GND 18 SIGNAL GND 20 SIGNAL GND 22 SIGNAL GND 24 SIGNAL GND 26 SIGNAL GND 28 SIGNAL GND 30 SIGNAL GND 32 SIGNAL GND 34 SIGNAL GND 36 SIGNAL GND 38 POWER GND 40 +5V CLK1 CLK2 D15 D14 D13 D12 D11 D10 D9 D8 D7 D6 D5 D4 D3 D2 D1 D0 +5V 1 3 5 7 9 11 13 15 17 19 21 23 25 27 29 31 33 35 37 39 2 4 6 8 10 12 14 16
Probing Solutions Specifications and Characteristics Isolation Adapter 01650-63203 Isolation adapters that connect to the end of the probe cable are designed to perform two functions. The first is to reduce the number of pins required for the header on the target board from 40 pins to 20 pins. This process reduces the board area dedicated to the probing connection. The second function is to provide the proper RC isolation networks in a very convenient package. Adapter RC Network 250 ohm 90.
State/Timing Modules Specifications and Characteristics Key Specifications* and Characteristics Agilent Model Number 16715A, 16716A, 16717A 16740A, 16741A, 16742A 16750A, 16751A, 16752A 16760A Maximum state acquisition rate on each channel 16715A, 16716A: 167 Mb/s 16717A, 333 Mb/s [1] 200 Mb/s 400 Mb/s [1] Full channel: 800 Mb/s Half channel: 1.
State/Timing Modules Specifications and Characteristics Key Specifications* and Characteristics (continued) Agilent Model Number 16710A, 16711A, 16712A Maximum state acquisition rate on each channel 100 Mb/s Maximum timing sample rate (half/full channel) Conventional: 500/250 MHz Transitional: 125 MHz Channels/module 102 Maximum channel count on a single time base and trigger 204 (2 modules) Memory depth (half/full channel) 16710A: 16/8K [1] 16711A: 64/32K [1] 16712A: 256/128k [1] Trigger resou
State/Timing Modules Specifications and Characteristics Agilent Technologies 16710A, 16711A, 16712A Supplemental Specifications* and Characteristics 370 ohms Probes (general-purpose lead set) 1.5pF Input resistance 100 KΩ, ±2% Parasitic tip capacitance 1.5 pF Minimum voltage swing 500 mV, peak-to-peak Threshold accuracy* ±(100 mV + 3% of threshold setting) Maximum input voltage ±40 V peak 7.4pF 100K ohm GROUND Figure 6.12.
State/Timing Modules Specifications and Characteristics Agilent Technologies 16710A, 16711A, 16712A Supplemental Specifications* and Characteristics (continued) Triggering Maximum trigger sequence speed 125 MHz, maximum Maximum occurrence counter 1,048,575 Range width 32 bits each Timer value range 400 ns to 500 seconds Timer resolution 16 ns or 0.1% whichever is greater Timer accuracy ±32 ns or ±0.
State/Timing Modules Specifications and Characteristics Agilent Technologies 16715A, 16716A, 16717A, 16740A, 16741A, 16742A, 16750A, 16751A, 16752A Supplemental Specifications* and Characteristics 370 ohms 1.5pF Probes (general-purpose lead set) Input resistance 100 KΩ, ± 2% Parasitic tip capacitance 1.5 pF Minimum voltage swing 500 mV, peak-to-peak Minimum input overdrive 250 mV Threshold range -6V to +6V in 10 mV increments Threshold accuracy* ± (65 mV + 1.
State/Timing Modules Specifications and Characteristics Agilent Technologies 16715A, 16716A, 16717A, 16740A, 16741A, 16742A, 16750A, 16751A, 16752A Supplemental Specifications* and Characteristics State Mode 16715A, 16716A, 16717A 167 Mb/s State Mode 16740A, 16741A, 16742A 16750A, 16751A, 16752A 200 Mb/s State Mode Maximum state acquisition rate on each channel 167 Mb/s 200 Mb/s Channel count 68 per module 68 per module Maximum channels on a single time base and trigger 340 340 Number of indepe
State/Timing Modules Specifications and Characteristics Agilent Technologies 16715A, 16716A, 16717A, 16740A, 16741A, 16742A, 16750A, 16751A, 16752A Supplemental Specifications* and Characteristics (continued) State Mode 16715A, 16716A, 16717A 167 Mb/s State Mode 16740A, 16741A, 16742A 16750A, 16751A, 16752A 200 Mb/s State Mode Trigger sequence level branching 4 way arbitrary “IF/THEN/ELSE” branching 4 way arbitrary “IF/THEN/ELSE” branching Trigger position Start, center, end, or user defined Start,
State/Timing Modules Specifications and Characteristics Agilent Technologies 16715A, 16716A, 16717A, 16740A, 16741A, 16742A, 16750A, 16751A, 16752A Supplemental Specifications* and Characteristics (continued) State Mode 16715A, 16716A, 16717A 167 Mb/s State Mode 16750A, 16751A, 16752A 400 Mb/s State Mode Maximum state acquisition rate on each channel 333 Mb/s 400 Mb/s Channel count (Number of modules x 68) - 34 (Number of modules x 68) - 34 Maximum channels on a single time base and trigger 306
State/Timing Modules Specifications and Characteristics Agilent Technologies 16715A, 16716A, 16717A, 16740A, 16741A, 16742A, 16750A, 16751A, 16752A Supplemental Specifications* and Characteristics (continued) State Mode 16715A, 16716A, 16717A 167 Mb/s State Mode 16750A, 16751A, 16752A 400 Mb/s State Mode Trigger resources 8 Patterns evaluated as =, ≠, >, <, ≥, ≤ 4 Ranges evaluated as in range, not in range 2 Occurrence counters 4 Flags 8 Patterns evaluated as =, ≠, >, <, ≥, ≤ 4 Ranges evaluated as in
State/Timing Modules Specifications and Characteristics Agilent Technologies 16715A, 16716A, 16717A, 16740A, 16741A, 16742A, 16750A, 16751A, 16752A Supplemental Specifications* and Characteristics (continued) Timing Mode (continued) 16715A, 16716A, 16717A 16740A, 16741A, 16742A 16750A, 16751A, 16752A Maximum trigger sequence speed 167 MHz 200 MHz Maximum trigger sequence levels 16 16 Trigger sequence level branching 4 way arbitrary “IF/THEN/ELSE” branching 4 way arbitrary “IF/THEN/ELSE” branchin
State/Timing Modules Specifications and Characteristics Agilent Technologies 16760A Supplemental Specifications* and Characteristics Probes E5378A Single-ended E5379A Differential E5380A Mictor E5382A Single-Ended Flying Leads Input resistance and capacitance Refer to figure 6.14 Refer to figure 6.14 Refer to figure 6.14 Refer to figure 6.15 Maximum state data rate supported 1.5 Gb/s 1.5 Gb/s 600 Mb/s 1.
State/Timing Modules Specifications and Characteristics Agilent Technologies 16760A Supplemental Specifications* and Characteristics (continued) Synchronous Data Sampling tWidth Figure 6.17. Data Sampling.
State/Timing Modules Specifications and Characteristics Agilent Technologies 16760A Supplemental Specifications* and Characteristics (continued) Synchronous state analysis 1.5 Gb/s mode 1.25 Gb/s mode 800 Mb/s mode 400 Mb/s mode 200 Mb/s mode Maximum data rate on each channel E5378A, E5379A probes: 1.5 Gb/s E5378A, E5379A probes: 1.
State/Timing Modules Specifications and Characteristics Agilent Technologies 16760A Supplemental Specifications and Characteristics (continued) Synchronous state analysis (continued) 1.5 Gb/s mode (only available with E5378A and E5379A probes) 1.25 Gb/s mode (only available with E5378A and E5379A probes) 800 Mb/s mode 400 Mb/s mode 200 Mb/s mode Maximum trigger sequence levels 2 2 4 16 16 Maximum trigger sequencer speed 1.5 Gb/s 1.
State/Timing Modules Specifications and Characteristics Agilent Technologies 16760A Supplemental Specifications and Characteristics (continued) Asynchronous Timing Analysis (continued) Conventional Timing Analysis Transitional Timing Analysis Sample period accuracy ±(250 ps + 0.01% of sample period) ±(250 ps + 0.01% of sample period) Channel-to-channel skew < 1.5 ns < 1.5 ns Time interval accuracy ±[sample period + (channel-to-channel skew) + (0.
State/Timing Modules Specifications and Characteristics Agilent Technologies 16760A Supplemental Specifications and Characteristics (continued) Eye scan mode 1.5 Gb/s mode 800 Mb/s mode Maximum clock rate 1.5 Gb/s 800 Mb/s Sample position range relative to clock +5ns to 10 ns -4 ns to +4 ns Sample (time) position resolution 12 ps 12 ps Sample position (time) accuracy +/- (50 ps + 0.01 * sample position) +/- (50 ps + 0.
Oscilloscope Modules Specifications and Characteristics 16534A Specifications* Bandwidth dc to 500 MHz dc offset accuracy ±(1% of offset + 2% of full scale) dc voltage measurement accuracy ±(1.5% of full scale + offset accuracy) Time interval measurement accuracy at maximum sampling rate, on a single scope card, on a single acquisition ±[(0.005% of D T) + (2E–6 x delay setting) + 100 ps] Trigger sensitivity (See notes) • dc to 50 MHz • 50 MHz to 500 MHz • 0.06 full scale • 0.
Oscilloscope Modules Specifications and Characteristics 16534A Characteristics* Vertical (Voltage) Vertical sensitivity range 16 mV full scale to 40 V full scale Vertical resolution 8 bits full scale Rise time (calculated from bandwidth) 700 ps dc gain accuracy ±(1.25% of full scale + 0.08% per °C difference from calibration temperature) dc offset range Vertical sensitivity • 16 mV full scale to 400 mV full scale • 400 mV full scale to 2.0 V full scale • 2.
Oscilloscope Modules Specifications and Characteristics 16534A Characteristics Horizontal (Time) Time base ranges 0.5 ns/div to 5 s/div Time base resolution 10 ps Delay range • pretrigger • posttrigger • -32 K x sample period • 320 ms or 1.6E7 x sample period, whichever is greater Time interval measurement accuracy forsampling rates other than maximum, for bandwidth-limited signals [signal rise time > 1.4/(sampling rate)], on a single card, on a single acquisition ±{(0.
Pattern Generation Modules Specifications and Characteristics 16720A Pattern Generator Characteristics Maximum memory depth 16 MVectors Number of output channels at ≤ 300 MHz clock 24 Number of output channels at ≤ 180 MHz clock 48 Number of output channels at ≤ 200 MHz clock 24 Number of output channels at ≤ 100 MHz clock 48 Number of different macros 100 Maximum number of lines in a macro 1024 Maximum number of parameters in a macro 10 Maximum number of macro invocations 1000 Maximum lo
Pattern Generation Modules Specifications and Characteristics Data Pod Characteristics Note: Data Pod output parametrics depend on the output driver and the impedance load of the target system. Check the device data book for the specific drivers listed for each pod.
Pattern Generation Modules Specifications and Characteristics Agilent 10465A ECL Data Pod (unterminated) Output type 10H115 (no termination) Maximum clock 300 MHz Skew [1] typical < 1 ns; worst case = 2 ns Recommended lead set Agilent 10347A 10H115 Agilent 10466A 3-State TTL/3.
Pattern Generation Modules Specifications and Characteristics Agilent 10469A 5 volt PECL Data Pod Output type 100EL90 (5V) with 348 ohm pulldown to ground and 42 ohm in series Maximum clock 300 MHz Skew [1] typical < 500 ps; worst case = 1 ns Recommended lead set Agilent 10498A 42 Ω 100EL90 348 Ω Agilent 10471A 3.3 volt LVPECL Data Pod Output type 100LVEL90 (3.
Pattern Generation Modules Specifications and Characteristics Agilent 10476A 3-State 1.8 Volt Data Pod Output type 74AVC16244 3-state enable negative true, 38 KΩ to GND, enabled on no connect Maximum clock 300 MHz Skew [1] typical < 1.5 ns; worst case = 2 ns Recommended lead set Agilent 10498A 74AVC16244 Agilent 10483A 3-State 3.3 Volt Data Pod Output type 74AVC16244 3-state enable negative true, 38 KΩ to GND, enabled on no connect Maximum clock 300 MHz Skew [1] typical < 1.
Pattern Generation Modules Specifications and Characteristics Data Cable Characteristics Without a Data Pod The Agilent 16720A and 16522A data cables without a data pod provide an ECL terminated (1 KΩ to –5.2V) differential signal (from a type 10E156 or 10E154 driver). These are usable when received by a differential receiver, preferably with a 100 Ω termination across the lines.
Pattern Generation Modules Specifications and Characteristics Clock Cable Characteristics Without a Clock Pod The Agilent 16720A and 16522A clock cables without a clock pod provide an ECL terminated (1 KΩ to –5.2V) differential signal (from a type 10E164 driver). These are usable when received by a differential receiver, preferably with a 100 Ω termination across the lines. These signals should not be used single ended due to the slow fall time and shifted voltage threshold (they are not ECL compatible).
Pattern Generation Modules Specifications and Characteristics Clock Pod Characteristics 10460A TTL Clock Pod Clock output type 10H125 with 47 Ω series; true & inverted Clock output rate 100 MHz maximum Clock out delay approximately 8 ns total in 14 steps (16720A only); 11 ns maximum in 9 steps (16522A only) Clock input type TTL – 10H124 Clock input rate dc to 100 MHz Pattern input type TTL – 10H124 (no connect is logic 1) Clock-in to clock-out approximately 30 ns Pattern-in to recognition ap
Pattern Generation Modules Specifications and Characteristics 10468A 5 volt PECL Clock Pod Clock output type 100EL90 (5V) with 348 ohm pulldown to ground and 42 ohm in series Clock output rate 300 MHz maximum Clock out delay approximately 8 ns total in 14 steps (16720A only); 11 ns maximum in 9 steps (16522A only) Clock input type 100EL91 PECL (5V), no termination Clock input rate dc to 300 MHz Pattern input type 100EL91 PECL (5V), no termination (no connect is logic 0) Clock-in to clock-out a
Pattern Generation Modules Specifications and Characteristics 10472A 2.5 volt Clock Pod Clock output type 74AVC16244 Clock output rate 200 MHz maximum Clock out delay approximately 8 ns total in 14 steps (16720A only); 11 ns maximum in 9 steps (16522A only) Clock input type 74AVC16244 (3.6V max) Clock input rate dc to 200 MHz Pattern input type 74AVC16244 (3.
Pattern Generation Modules Specifications and Characteristics 10477A 3.3 volt Clock Pod Clock output type 74AVC16244 Clock output rate 200 MHz maximum Clock out delay approximately 8 ns total in 14 steps (16720A only); 11 ns maximum in 9 steps (16522A only) Clock input type 74AVC16244 (3.6V max) Clock input rate dc to 200 MHz Pattern input type 74AVC16244 (3.
Trade-In, Trade-Up Advance to the Latest Technology with Agilent’s “Trade-Up” Program Comprehensive Economical Convenient • Purchase from an extensive list of Agilent test and measurement products • Trade in a wide variety of test equipment for substantial credit • Upgrade for less • Stretch your test equipment budget • Reduce support costs for aging equipment • Simply call your local Agilent sales office • Mention Agilent Promotion 4.65 • Let us evaluate your savings opportunities Purchase...
Ordering Information Mainframes and Mainframe Accessories Product Number Description Includes 16700B Modular mainframe with five measurement module slots and one emulation or multiframe module slot • • • • • • 16702B Modular frame with built-in 800x600 LCD display with touchscreen. Includes five measurement slots and one emulation or multiframe module slot Same as 16700B plus: • 12.
Ordering Information E5850A Logic Analyzer - Infiniium Oscilloscope Correlation Time Fixture Product Number Description Includes E5850A Logic analyzer - Infiniium oscilloscope time correlation fixture All BNC cables needed to connect to logic analyzer and oscilloscope Agilent 1184A Testmobile The Agilent 1184A testmobile gives you a convenient means of organizing and transporting your logic analysis system mainframes and accessories.
Ordering Information Measurement Module Compatibility Table Measurement Module Category Model Number Description State and Timing 16510A* 16510B* 16500C* 16500A/B* 25 MHz State; 100 MHz Timing; 1 K memory depth √ √ 35 MHz State; 100 MHz Timing; 1 K memory depth √ √ 16540A/16541A* 100 MHz State; 100 MHz Timing; 4 K memory depth √ √ 16540D/16541D* 100 MHz State; 100 MHz Timing; 16 K memory depth √ √ 16542A* 100 MHz State; 100 MHz Timing; 1 M memory depth √ √ 16550A* 100 MHz State; 500
Ordering Information Measurement Module Compatibility Table (continued) Measurement Module Category Model Number Oscilloscope High Speed Timing 16500C* 16500A/B* 16530A/16531A* 2 Channel; 100 MHz Bandwidth; 400 MSa/s; 4 K memory depth √ √ 16532A* 2 Channel; 250 MHz Bandwidth; 1 GSa/s; 8 K memory depth √ √ 16533A* 2 Channel; 250 MHz Bandwidth; 1 GSa/s; 32 K memory depth √ √ √ 16534A 2 Channel; 500 MHz Bandwidth; 2 GSa/s; 32 K memory depth √ √ √ Emulation 16700 Series 16600 Series 1
Ordering Information Agilent Wedge Probe Adapters IC Leg Spacing Number of Signals Quantity of Probes Shipped Probe Model Number 0.5 mm 3 1 E2613A 0.5 mm 3 2 E2613B 0.5 mm 8 1 E2614A 0.5 mm 16 1 E2643A 0.65 mm 3 1 E2615A 0.65 mm 3 2 E2615B 0.65 mm 8 1 E2616A 0.65 mm 16 1 E26144A Agilent Elastomeric Probing Solutions Package Type IC Leg Spacing Probe Model Number 240-pin PQFP/CQFP 0.5 mm E5363A Probe. E5371A 1/4 flexible cable 208-pin PQFP/CQFP 0.
Ordering Information Options and Accessories for Agilent 16534A Oscilloscope Modules Agilent Option Option Description • • • • • • • • • • • • • • • • 001 ABJ 0B0 1BP 0B3 0BF W17 W03 Add one Agilent 1145A, dual, active 750 MHz probe Japanese user's reference Delete manuals MIL-STD 45662A calibration with test data Add service manual Add programming manual set for a 16500 (not required for a 16700) Convert standard warranty to one-year-on-site warranty Convert standard warranty to 90-day-on-site warran
Ordering Information Accessories for Agilent 16720A Pattern Generator Modules Accessories Model Number Description Accessories Model Number Description 10460A TTL clock pod 10476A 3-state 1.8 volt data pod 10461A TTL data pod 10477A 3.3 volt clock pod 10462A 3-state TTL/CMOS data pod 10483A 3-state TTL/3.
Third-Party Solutions Our solutions partners offer a wide array of accessory products for the Agilent Technologies logic analysis systems. Agilent's solution partners offer complementary products covering probing clips, specialized analysis probes for over 200 microprocessors, and software tools for ASIC emulation and test system design. Solutions Partner Application Focus Contact Information Advanced Logic Design (ALD) Product design services (digital) www.ald.com Aptix ASIC emulation www.aptix.
Support, Warranty and Related Literature Support and Services Warranty Agilent's support services complement your logic analysis system to provide a complete solution to your digital design and debug problems. By taking advantage of Agilent's expertise you can concentrate on your particular design projects and applications, rather than your debug tools, resulting in increased productivity.
www.agilent.com Agilent Technologies’ Test and Measurement Support, Services, and Assistance Agilent Technologies aims to maximize the value you receive, while minimizing your risk and problems. We strive to ensure that you get the test and measurement capabilities you paid for and obtain the support you need. Our extensive support resources and services can help you choose the right Agilent products for your applications and apply them successfully.