
System information


5
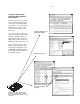
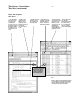
Once You Acquire
the Trace . . .
...filter out unexecut-
ed code fetches from
the inverse assem-
bled trace to view
executed code only
using Agilent’s
advanced inverse
assembly filtering for
popular processors.
...quickly locate a
specific function,
variable, or text
string. The system
maintains a history of
previous text
searches for quick
recall.
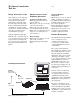
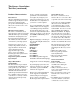
Also...
Analyze a function’s behavior without viewing
calls to subroutines or interrupts by using the
analyzer’s filtering capabilities to focus on a
specific part of the executed software.
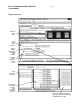
...scroll or step through
the time-correlated
source code (left) or
inverse-assembled
trace listing (right)
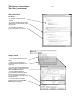
...“step” through the
trace at the source-
code level or the
assembly level.
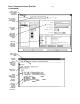
Locate the cause of a
problem by “stepping
backward” from the
point where you see
a problem to its root
cause.
...set the data type to
“Symbols” to view file
and symbol names or
”line #s” to view file
name and line number.
...measure the actual
execution time
between two points in
the software. Every
trace is nonintrusive
and every captured
event is time stamped.
The Source Correlation
Tool Set (continued)
...click the source line
which you want to
trace about on your
next acquisition.