
System information


4
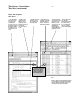
When You Want
to Trace . . .
...on a variable to see what caused data
corruption.
...on a function to determine where it is being
called from in order to understand the context
of a system error.
...on a line number to determine if a
specific code segment is ever executed.
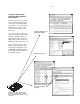
Simply Click . . .
... to trace about a variable, function, or line
number.
... to halt processor execution with an
integrated emulation module when the trace
event occurs.
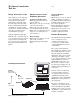
...to use text search to quickly navigate through
hundreds of symbols. To recall previous entries
when rotating through debug tests.
...to specify alignment conditions for
processors that don’t include lower address
bits on the bus. This is necessary if your
processor uses bursting or byte enables when
fetching instructions.
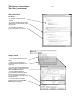
...to use address offsets for code that is
dynamically loaded or moved from ROM to
RAM during a boot-up sequence.
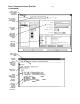
The Source Correlation
Tool Set (continued)