
System information

27
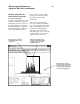
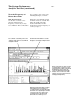
the occurrence rate of any event,
including interrupts, over time.
Define the event and time period
in which events are counted. Also
define the width of the time
buckets and number of time
buckets based on the frequency of
events you expect.
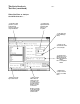
View the Frequency of
Events Over Time
Time Overview Tool
Use the time overview tool to
show the variation in the
frequency of events as you vary
test conditions. The tool measures
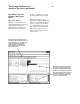
Elusive system crashes are often caused by
too many interrupts occurring over a short
period of time. If the software cannot handle
all simultaneous service requests, the
system can exhibit random defects while
leaving no clues as to their cause. In this
situation, you need a tool that can measure
and display interrupt loading.
The System Performance
Analysis Tool Set (continued)
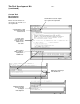
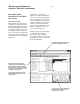
Use “Comments” to document your trace. The
“Comments” field contents are saved with the
configuration and data.
Use the markers in this window to correlate
interrupts to a state listing or timing waveform.
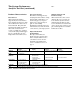
Embedded systems manage the flow of data to
and from physical sensors. Problems can
occur if the system does not frequently acquire
data from the sensor. By defining an event that
corresponds to the sensor’s address space,
you will get an image of the flow of data
between the sensor and the processor.