
System information

26
execution scenarios so you can
decide if optimization is needed.
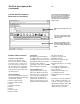
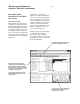
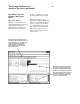
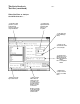
The time interval tool uses a
histogram to display a distribution
of the execution time of a specific
function or of the time between
two user-defined events. Use the
tool to measure setup and hold
times, the jitter between two
edges, or the variation between
two bus states.
Determine a Specific
Routine’s Execution
Times
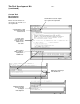
Time Interval Tool
Examine execution times and
verify signal timing specifications
using the time interval tool.
Results from the tool help you
determine the best and worst
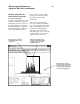
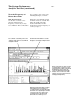
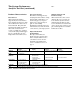
Data is displayed in histograms, which can
be exported to your host computer either as
histograms or as tabular formatted text files.
Statistics such as maximum time, minimum
time, standard deviation and mean help you
document system behavior. Use “accumu-
late mode” to analyze the behavior of your
system over a long period of time.
The System Performance
Analysis Tool Set (continued)
Because time interval measurements often
depend upon hardware-software interaction,
the event definition can be a combination of
symbolics and hardware events. Data
qualification can be used to define the
specific hardware context in which the
analysis will be made.