
System information

25
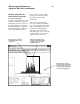
Use this tool to show which
functions are using the most CPU
cycles. It can also show the share
of the workload that each proces-
sor in a multiple-processor system
carries or determine if the system
is balanced. Bus measurements,
such as headroom analysis, can be
made by examining the ratio of
active to idle status states.
Computer systems take advantage
of cache memory to improve
performance. The analysis of
cache hits and misses can be made
by defining the states correspond-
ing to hits and misses.
Determine which
Functions Use the Most
CPU Cycles
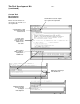
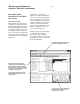
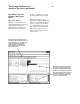
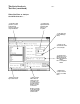
State Interval Tool
Help prioritize functions that are
candidates for duration measure-
ments using the time interval tool.
The histogram display shows the
percentage of time the system is
spending in each procedure, func-
tion, or event (states). Events are
defined as patterns or ranges asso-
ciated with any set of data (labels,
symbols).
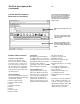
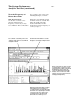
Display just the symbols you want to
evaluate by using the symbol-navigation
utility. The utility automatically configures
the tool for the selected function and vari-
able names from large symbol files created
by complex software projects.
To help simplify your display, delete all
functions below a selected point with a
single mouse click.
Pass the mouse over a histogram bar and
bucket information gives you detailed
information for each event.
Sort and display symbols alphabetically by
event name or by the number of hits.
The System Performance
Analysis Tool Set (continued)