
System information

24
Identify which Events
Occur Most Frequently
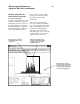
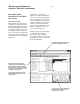
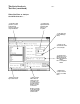
State Overview Tool
Use this tool as the first step of the
analysis or optimization process to
identify which events occur most
frequently during a measurement.
The tool interprets the captured
data and displays the number of
hits for each possible bus state.
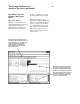
Narrow in on an area of interest
using built-in qualification and
zoom functions.
Pinpoint regions of high memory
activity to determine which routines
or operations are responsible for
throughput bottlenecks.
Measure memory coverage or
stack usage by observing whether
memory locations are accessed.
You can also detect which periph-
erals are most frequently used.
The System Performance
Analysis Tool Set (continued)
Isolate defects, such as invalid
pointers, when used in combina-
tion with the 16700A Series
filtering tool.
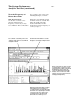
When used on an oscilloscope
trace, the tool displays a distribu-
tion of voltages for the signal. The
shape of the distribution can tell
you whether a digital signal is
spending too much time in the
switching region, or you can evalu-
ate the linearity of the output of a
digital-to-analog converter.