
System information

17
With Custom Tools
You Can:
Enhance How Data is Displayed
• Color-code specific states of your
trace.
• Display some of your trace data in
engineering units.
• Convert the raw trace of a propri-
etary bus to a transaction-level
trace of that bus.
Manipulate Data
• Unravel interleaved data into two
or more columns of data.
• Combine the traces of two differ-
ent analyzers into one trace, with
each column being combined or
separately displayed as prescribed
by you.
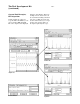
• Modify your scope trace using an
algorithm developed by you, such
as an analog filter, beat frequency,
or DSP algorithm.
Read or Write External Files
• Accumulate information from
repetitive traces taken by the
analyzer in a file on your PC or
UNIX workstation.
• Write specific types of states or
trace data that have been analyzed
to an Excel consumable ASCII file
on your PC or UNIX workstation.
• Use information read from a file
on your PC or UNIX workstation
to modify the display of an
analyzer trace.
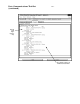
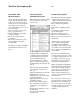
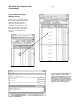
Custom Tool Examples,
Added Text in Trace
This example shows how a custom
tool can convert data to text to
present information in a form that
is much easier to understand than
the raw data.
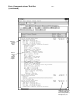
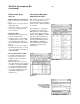
The original trace comes from a
control unit in an automobile.
Embedded in the data is informa-
tion about the engine and trans-
mission. When MODE = 0, DATA
represents engine information,
including RPM, fuel level, fuel to
air ratio, and manifold pressure.
When MODE = 1, DATA repre-
sents transmission information,
including gear position and
temperature.
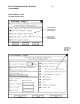
This custom tool allows the
user to specify Fahrenheit or
Centigrade for the engine
temperature data.
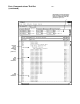
Output of Custom Tool
Original Trace
The Tool Development Kit
(continued)
Parameter Interface of Custom Tool