
Technical data


Module 7
Measurement Functions
7-41
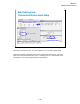
to draw regression line
to get slope of the line
SMU Series Resistor
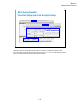
Function Setup and Auto Analysis Setup
The analysis function and the auto analysis function are used to calculate the resistance value.
This auto analysis setup will draw the regression line for the X-Y1 curve. And the analysis function
@L1G is used to pass the slope of the line to the R1 variable.