
User`s guide

35
Operation
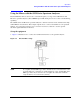
Using the 11970A, Q, U, V, and W Mixers with the X- Series Signal Analyzers (Option EXM)
frequency or a start and stop frequency.
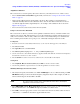
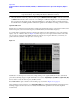
7. Many responses may appear on screen. Turn on the Signal ID function to identify true signals from
images and harmonics.
Press
Input Output, External Mixer, Signal ID Mode, Image Suppress, Signal ID On.
See “Signal ID” on page 38 for more information.
Amplitude Calibration
1. See Loading Conversion Loss Data for the PXA Signal Analyzer below. This will guide you through
entering the conversion loss data provided with the mixer, into a corrections file that can be activated
to provide amplitude corrected measurements.
2. To access corrections, press
Input/ Output, More, Corrections, Select Correction.
3. Chose a correction from the list. Note that you used one of the Corrections numbered 1-6 when you
entered the conversion loss data into the instrument.
4. Press
Correction On to apply the corrections to the measurement.
NOTE Assure only ONE correction file is turned on because it is possible to turn on
multiple correction files, and if some of the files share the same frequency points,
the correction that results for those shared frequency points will cause
measurement errors. Therefore assure that only the correction file required for the
measurement is turned on, and turn off all other corrections.
Loading Conversion Loss Data for the PXA Signal Analyzer
The conversion loss data supplied with your mixer can be loaded into your signal analyzer from one of
two sources:
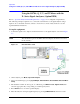
• By downloading the 70xxxxxx_X.csv file located on the CD ROM disk that is provided with your
mixer. The 70xxxxxx_X.csv file is transferred from the CD to a USB memory device, and then the
USB memory device inserted into the PXA, and the file transferred to one of the analyzer corrections
array locations. The USB memory device should be scanned for viruses before use.
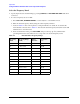
• The mixer ships with a printed copy of the conversion loss data. Find the printed copy conversion
loss data that has the text "For Use with Agilent X-Series analyzers only". The conversion loss data
will need to be manually entered as frequency and amplitude pairs into the analyzer corrections file.
An example of calibration data is shown Figure 2-19 on page 57.
The CD also contains 70xxxxxx_X.pdf files of the conversion loss data that can be printed, and then
manually entered into a Correction array location. You will need to enter the frequency and amplitude
pairs into the analyzer corrections file. An example of calibration data is shown Figure 2-19 on
page 57.