
User Manual Part 2


117
2852 A EN 20070205
DRYSTAR AXYS
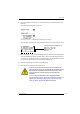
6 Press the Up/Down arrow keys to select the desired tray, followed by the Con-
firm key.
The following screens appear successively:
The Drystar AXYS will automatically print the QC test image.
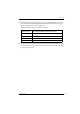
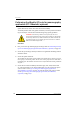
After the image is printed, the system will display all measured optical density values:
7 Record the Base + Fog, low, mid and high density values on Charts 2A and 2B
(‘Drystar AXYS Daily Density Control Chart’). Also record the date and time of
the test on the charts and on the QC mammography test images. Refer to Refer
to “Charts for mammography QC (optional)” on page 155.
8 Press the Confirm key to return to the main menu.
9 Press the ok key to return to the main menu.
WARNING: In case the measure results are not within the aim
values, the reason for the unacceptable density variations must be
identified and resolved before any further clinical films can be
processed. This may include repeating the film calibration
procedure.
WARNING: For possible causes of non-compliance and the
respective actions, refer to “Preventive maintenance schedule” on
page 121 and “Maintaining image quality and resolving image
quality problems” on page 258 (Reference manual).
DD: 1.56
(Densitometer=MB924)
The density levels are displayed, e.g:
Max D: x.x Hi D: 2.23
Mid D: 1.13 Lo D: 0.4
Base+Fog: 0.20
DD: x.xx