
User's Manual


Power Quality Analyzer Model 3945-B
57
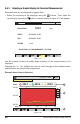
Display of the average voltage for each of the 3 voltages. Moving the cursor
with the
buttonsupdatesthevaluestoreectthenewcursorposition.
Selection of the 3 phases or each phase separately with the
buttons.
Returns to the screen where the measurement to be displayed is selected.
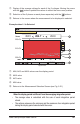
Example when L1 is Selected
220.0V
210.0V
200.0V
mn>
Vrms
10 15 20 25 30
204.5 204.9
204.7 v
3L
L1
L2
L3
07/25/02 10:38 100
%
07/25/02 10:13:21
2
4
1
5
3
Figure 5-23
MIN, AVG and MAX values over the display period
MAX value
AVG value
MIN value
ReturnstotheMeasurementSelectionScreen(seeFig.5-21)
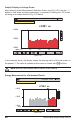
When the display period is different from the averaging integration period:
• The average value is calculated with the sum of each integration period
stored.
• The extreme values are the minimum and the maximum of an integration period
during the display period selected with the cursor.