
Owner manual

Page 18
Bank Lo of 1, a period of 200 ms, and a cell value of 50, the F/IC will output 2
volts for 50 ms, 1 volt for 150ms, 2 volts for 50 ms, etc.
“Percent” mode - The F/IC will measure the O2 voltage, then modify it by the
percentage value in the “O2 Map”. For a measured value of 1 volt, a period of
200ms, and a cell value of 20, the F/IC will measure 1 volt for 5ms, then output
1.2 volts for 195ms, then measure again for 5ms, etc.
“Offset” mode - The F/IC will measure the O2 voltage, and then modify it by the
offset value in the O2 map. For a measured value of .7 volts, a period of 200ms,
and a cell value of -.25, the F/IC will measure 0.7volts for 5ms, then output 0.45
volts for 195ms, then measure again for 5ms, etc
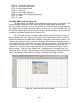
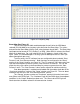
Viewing the O2 Map as AFR (See Figure 29.)
In the “Voltage and “Offset” modes, the software can be configured to view the
“O2 Map” as AFR values rather than voltage values. To display the “O2 Map” as AFR
values, the “View as AFR” checkbox must be checked, and the “AFR to Voltage Table”
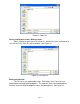
must be configured. The “View as AFR” checkbox is located in the “O2” section of the
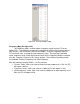
“Setup” window, see Figure 28. To open the “AFR to voltage Table”, click on the AFR
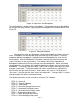
table icon next to the “View as AFR” checkbox. The “AFR to Voltage Table” contains
two columns and 20 rows, see Figure 27. When completing the “Volts out” column, the
lowest voltage must be in the top row, while the largest voltage value must go in the
bottom row. In the “AFR” column, enter the corresponding AFR for each voltage output.
Once the “AFR to Voltage Table” is complete, AFR values can be entered into the O2
map. For a given cell value in the O2 map, the FIC will take the value from the O2 map
and look at the “AFR to Voltage Table”. The FIC will then output the corresponding
voltage value.
Figure 28. O2 Map