
User`s guide
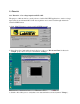
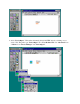
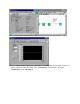

15.The basic steps to get AIVoltageIn data are now complete. You can change the window to the
Front Panel window and click the “Run” or “Run Continuously” button to execute
AIVoltageIn VI.
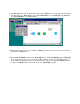
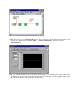
16.If your waveform chart does not show the whole graph, you can change the scale of the Y-axis.
To change the Y axis scale on the waveform chart, move the cursor to the graphic origin, click
the left mouse button, and type in the desired value.