
Use Instructions
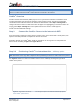
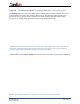
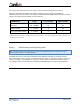
Table Of Contents
- Device Description
- Indications for Use
- Components Included with the Cardi/o Remote Patient Monitor System
- CARDI/O® USE INSTRUCTIONS
- Cardi/o® Overview
- Cardi/o® Remote Patient Monitor (RMP) may be use for synchronous telehealth consultations where real-time intermittent spot-checking of vital signs may be desired; and for asynchronous telehealth consultations where historical data can be viewed and d...
- Step 1. Connect the Cardi/o® Sensor to the Internet via WiFi
- Scan the barcode containing a unique ID that is located on the sensor device with a smart phone, then input the local WiFi passcode to complete the Sensor connection.
- Determine whether the Cardi/o® RMP will be for intermittent use or long-term use and position the Sensor device according to Figure A or Figure B below.
- Step 2.A Positioning Cardi/o® for Intermittent Use – tabletop option
- Step 2.B Positioning Cardi/o® for Long Term Use – wall-mount option
- Step 3. Accessing Patient Data
- Step 4. Managing Patient Alerts
- Step 5. Downloading and Reporting Data
- Cardi/o® Sensor Return or Disposal
- Troubleshooting
- Contact Information
- Product Specifications
- General Symbols

IFU-EUA Rev. 01
Date: 01Sep2020
Page 9 of 17
See Figure E below for five (5) primary steps to navigate patient data collected by the Cardi/o
®
Sensor.
Step 4. Managing Patient Alerts
See Figure F to the right to locate alerts on the
main Residents Dashboard screen of the
Cardi/o
®
App. The number on the bell indicates the
number of patients that have exceeded one or
more predefined thresholds related to heart rate,
respiratory rate, and stress level.
Clear alerts by swiping left on each highlighted bar
on the Patient list and click “clear alert”.
You may also enable the mobile phone SMS Text
Alerts feature in the Cardi/o
®
Central Dashboard
administrator portal by assigning telephone
numbers to respective caregivers.
Note:
Step 1: Displays a patient dashboard
Step 2: Click the heart rate bar to view a graph indicating data trending over time.
Step 3: Click the respiratory rate bar to view a graph indicating data trending over time.
Step 4: Click the stress bar to view a graph indicating data trending over time.
Step 5: Click the notes icon [ ] in the main patient dashboard (seen in Step 1) to type notes pertaining
to patient data or consultation.
Figure E: Investigate patient data by clicking the respective bars. Access historical data trends for analysis by clicking the
down arrow located on the bar of each
parameter.
Figure F: The number of active alerts is indicated in the red dot.