
Installation Manual


INSTALLATION ON THE VEHICLE
31
The technical materials and information contained in this document are strictly confidential and the exclusive property of Advanced Microwave Engineering s.r.l.
These materials and information are intended solely for the purpose designated and may not be used otherwise.
It is not permitted to disclose or reproduce them in whole or in part without express written permission.
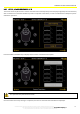
8.8 System activation distances. Setting the powers transmitted
The section above dealt with how to calculate stopping distances for an industrial vehicle. When estimating the distances
at which a tag potentially in danger of collision should be detected, a distance margin should be considered as well. A zero
distance cannot and should not be set. Besides, the detection system has reaction times that have to be taken into account.
To these distances identified, we should add a value that can be calculated according to the chart below.
Speed [km/h] operational margin [m]
3 0.6
4 0.8
5 1.0
6 1.2
7 1.4
8 1.6
9 1.8
10 1.9
11 2.1
12 2.3
13 2.5
14 2.7
15 2.9
16 3.1
17 3.3
18 3.5
19 3.7
20 3.9
21 4.1
22 4.3
23 4.5
24 4.7
Now the detection distance we want can be calculated. For instance, if a system is installed in a forklift truck falling within
category A1, with a maximum speed of 12 km/h and manual braking, the total braking distance will be 7.7 m; some further
2.3 m should be added as margin, to a total distance of 10 meters.
Once the desired distance is defined, adjust the power of the relevant sensors until a safe coverage for the distance
calculated is guaranteed. The distance previously identified is that from the interfering worker to the point of contact that
is closest to the forklift truck, which in a scenario of a front impact with a forklift truck is the forks.
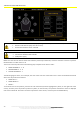
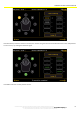
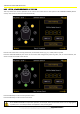
Since the distance between the sensors and the first point of contact is not known a priori, and since the position of the
sensors may vary a lot, check the activation distance by applying control tests. Keep in mind that the low that governs the
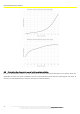
power set and the activation distance is not linear. Find below some graphs that show the progress of the ratio between
these two values for both long range (pre-warning) and short range (warning).