
Operation Manual
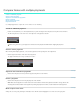
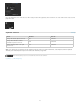
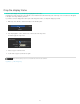
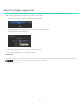
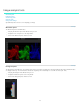

Image analysis tools
To the top
To the top
Waveform panel
Histogram panel
Vectorscope panel
Channel views
Change tool settings
SpeedGrade provides various tools for analyzing your image.
Waveform panel
The Waveform panel shows RGB values.
To display the Waveform panel in the Monitor view, press W.
To adjust the size of the panel, use the drag handles.
To undock the Waveform panel, click the lock icon.
Histogram panel
The Histogram shows RGB values. The minimum Luma values per channel are displayed as numerical feedback at the bottom. Maximum values
are displayed at the top. Two horizontal lines indicate the output range. The default range is set to CIN code values (95 - 685).
To display the Histogram in the Monitor view, press H.
To adjust the width of the panel, use the drag handle.
To undock the Histogram panel, click the lock icon.
28