
Operation Manual

19
Workspace
Last updated 11/30/2015
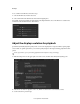
Image analysis tools
SpeedGrade provides various tools, like the following, to analyze your image:
• Histogram
• Vectorscope
• RGB Parade
• Luma Waveform
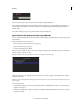
These tools are now grouped together and available from the Analysis Tools panel.
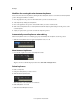
To display the Analysis Tools panel, use the keyboard shortcut A, or click the arrow on the upper-left Monitor panel.
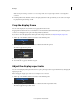
You can adjust the size of the Analysis Tools panel using the drag handles.
Use the context menu to choose which video scope you want to view.
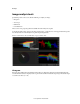
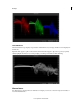
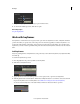
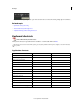
Histogram
Histogram shows RGB values. The minimum Luma values per channel are displayed as numerical feedback at the
bottom. Maximum values are displayed at the top. Two horizontal lines indicate the output range. The default range is
set to CIN code values (95 - 685).