
Operation Manual

124
USING PHOTOSHOP
Color and tonal adjustments
Last updated 12/5/2011
Note: You can also choose Image > Adjustments > Levels. But keep in mind that this method makes direct adjustments
to the image layer and discards image information. Settings are adjusted in the Levels dialog box.
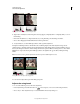
2 In the Adjustments panel, do one of the following to neutralize a color cast:
• Click the Set Gray Point Eyedropper tool . Then click in a part of the image that is neutral gray.
• Click Auto to apply the default automatic levels adjustment. To experiment with other automatic adjustment
options, choose Auto Options from the Adjustments panel menu, then change Algorithms in the Auto Color
Corrections Options dialog box.
In general, assign equal color component values to achieve a neutral gray. For example, assign equal red, green, and
blue values to produce a neutral gray in an RGB image.
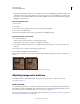
Curves overview
You can use Curves or Levels to adjust the entire tonal range of an image. The Curves adjustment lets you adjust points
throughout the tonal range of an image (from shadows to highlights). Levels have only three adjustments (white point,
black point, gamma). You can also use Curves to make precise adjustments to individual color channels in an image.
You can save Curves adjustment settings as presets. See
“Save adjustment settings” on page 119 and “Reapply
adjustment settings” on page 120.
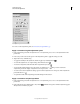
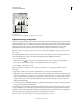
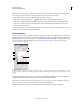
Curves options
A. Sample in image to set black point. B. Sample in image to set gray point. C. Sample in image to set white point. D. Edit points to modify
the curve. E. Draw to modify the curve. F. Curves type drop-down menu. G. Set black point. H. Set gray point. I. Set white point. J. Show
clipping.
In the Curves adjustment, the tonal range is represented as a straight diagonal baseline, because the input levels (the
original intensity values of the pixels) and output levels (new color values) are identical.
Note: After you’ve made an adjustment to the tonal range of a curve, Photoshop continues to display the baseline as a
reference. To hide the baseline, turn off Show Baseline in the Curve Display Options.
The horizontal axis of the graph represents the input levels; the vertical axis represents the output levels.
A
G
F
H
I
J
B
C
D
E