
Operation Manual

470
USING ILLUSTRATOR
Graphs
Last updated 11/8/2011
3 Do any of the following:
• To change the placement of the legend, select an option for Legend.
• To specify how multiple pie graphs are displayed, select an option for Position.
• To specify how wedges are sorted, select an option for Sort.
Percentages and legends are painted black by default. If a pie wedge with a dark background obscures a legend, repaint
the dark background. Use the Group Selection tool to select the dark pie wedges, and paint the wedges using the Color
panel or Swatches panel.
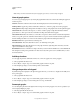
Pie graph options
Legend Determines the placement of the legend.
• Standard Legend Places column labels outside the graph; this is the default. Use this option when you combine pie
graphs with other kinds of graphs.
• Legends In Wedges Inserts labels into the corresponding wedges.
• No Legend Omits legends entirely.
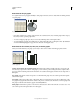
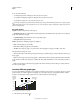
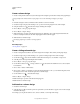
Position Specifies how multiple pie graphs are displayed.
• Ratio Sizes the graphs proportionally.
• Even Makes all the pie graphs the same diameter.
• Stacked Stacks each pie graph on top of the other, and each graph is sized proportionally to each other.
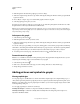
Sort Specifies how wedges are sorted.
• All Sorts the wedges of the selected pie graphs from largest to smallest value proceeding clockwise from the top of
the pie graph.
• First Sorts the wedges of the selected pie graphs so that the largest value in the first graph will be placed in the first
wedge, and the rest will sort from largest to smallest. All
other graphs will follow the order of the wedges in the first
graph.
• None Sorts the wedges of the selected pie graphs in the order in which you entered values proceeding clockwise
from the top of the graphs.
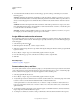
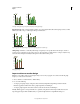
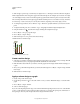
Combine different graph types
You can combine different graph types in one graph. For example, you may want one set of data to appear as a column
graph and other sets of data to appear as a line graph. You
can combine any type of graph with any other, with the
exception of scatter graphs. Scatter graphs cannot be combined with any other graph type.
Combining columns and lines in one graph
1 Select the Group Selection tool .
0%
50%
100%
150%
200%
250%
$0
$5
$10
$15
$20
$25
Wholesale
Retail
Product C Product B Product A
2000 1990 1980
Varietal Retail
Price per Unit
Retail and
Wholesale
Price Index