
Operation Manual

26
USING ILLUSTRATOR
Workspace
Last updated 11/8/2011
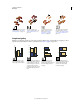
Slicing and cutting tool gallery
Illustrator provides the following tools for slicing and cutting objects:
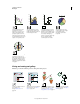
The Line Graph tool creates
graphs that use points to
represent one or more sets of
values, with a different line
joining the points in each set.
This type of graph is often used
to show the trend of one or more
subjects over a period of time.
The Area Graph tool creates
graphs that are similar to line
graphs, but emphasizes totals as
well as changes in values.
The Scatter Graph tool creates
graphs that plot data points as
paired sets of coordinates along
the x and y axes. Scatter graphs
are useful for identifying
patterns or trends in data. They
also can indicate whether
variables affect one another.
The Pie Graph tool creates
circular graphs whose wedges
represent the relative
percentages of the values
compared.
The Radar Graph tool creates
graphs that compare sets of
values at given points in time or
in particular categories, and is
displayed in a circular format.
This type of graph is also called a
web graph.
The Slice tool divides artwork
into separate web
images.“Create slices” on
page 392
The Slice Selection tool (Shift-K)
selects web slices. See “Select
slices” on page 392
The Eraser tool (Shift-E) erases
any area of the object over which
you drag. See “Erase objects
using the Eraser tool” on page 79
The Scissors tool (C) cuts paths
at specified points. See “Split a
path” on page 80
20
30
40
50
60
70
80
50 40 30 20 10
0
20
40
60
80
100
10 20 30 40 50
0
10
20
30
40
50
D C B A
10
20
30
40
50