
Operation Manual

25
USING ILLUSTRATOR
Workspace
Last updated 11/8/2011
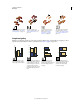
Graph tool gallery
Illustrator provides nine graph tools, each one for creating a different type of graph. The type of graph you choose
depends on the information you want to communicate. See
“Create a graph” on page 463.
The Symbol Spinner tool rotates
symbol instances. See “Rotate
symbol instances” on page 110.
The Symbol Stainer tool
colorizes symbol instances. See
“Stain symbol instances” on
page 110.
The Symbol Screener tool
applies opacity to symbol
instances. See “Adjust
transparency of symbol
instances” on page 111.
The Symbol Styler tool applies
the selected style to symbol
instances. See “Apply a graphic
style to symbol instances” on
page 111.
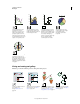
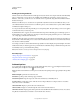
The Column Graph tool (J)
creates graphs that compare
values using vertical columns.
The Stacked Column Graph tool
creates graphs that are similar to
column graphs, but stacks the
columns on top of one another,
instead of side by side. This
graph type is useful for showing
the relationship of parts to the
total.
The Bar Graph tool creates
graphs that are similar to
column graphs, but positions the
bars horizontally instead of
vertically.
The Stacked Bar Graph tool
creates graphs that are similar to
stacked column graphs, but
stacks the bars horizontally
instead of vertically.
0
10
20
30
40
50
60
70
80
B A
0
20
40
60
80
100
B A
0 10 20 30 40 50 60 70 80
B
A
0 20 40 60 80 100
B
A