
Operation Manual
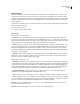
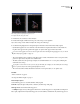
Table Of Contents
- Contents
- Chapter 1: Getting started
- Chapter 2: Digital audio fundamentals
- Chapter 3: Workflow and workspace
- Chapter 4: Setting up Adobe Audition
- Chapter 5: Importing, recording, and playing audio
- Chapter 6: Editing audio files
- Displaying audio in Edit View
- Selecting audio
- Copying, cutting, pasting, and deleting audio
- Visually fading and changing amplitude
- Working with markers
- Creating and deleting silence
- Inverting and reversing audio
- Generating audio
- Analyzing phase, frequency, and amplitude
- Converting sample types
- Recovery and undo
- Chapter 7: Applying effects
- Chapter 8: Effects reference
- Amplitude and compression effects
- Delay and echo effects
- Filter and equalizer effects
- Modulation effects
- Restoration effects
- Reverb effects
- Special effects
- Stereo imagery effects
- Changing stereo imagery
- Binaural Auto-Panner effect (Edit View only)
- Center Channel Extractor effect
- Channel Mixer effect
- Doppler Shifter effect (Edit View only)
- Graphic Panner effect
- Pan/Expand effect (Edit View only)
- Stereo Expander effect
- Stereo Field Rotate VST effect
- Stereo Field Rotate process effect (Edit View only)
- Time and pitch manipulation effects
- Multitrack effects
- Chapter 9: Mixing multitrack sessions
- Chapter 10: Composing with MIDI
- Chapter 11: Loops
- Chapter 12: Working with video
- Chapter 13: Creating surround sound
- Chapter 14: Saving and exporting
- Saving and exporting files
- Audio file formats
- About audio file formats
- 64-bit doubles (RAW) (.dbl)
- 8-bit signed (.sam)
- A/mu-Law Wave (.wav)
- ACM Waveform (.wav)
- Amiga IFF-8SVX (.iff, .svx)
- Apple AIFF (.aif, .snd)
- ASCII Text Data (.txt)
- Audition Loop (.cel)
- Creative Sound Blaster (.voc)
- Dialogic ADPCM (.vox)
- DiamondWare Digitized (.dwd)
- DVI/IMA ADPCM (.wav)
- Microsoft ADPCM (.wav)
- mp3PRO (.mp3)
- NeXT/Sun (.au, .snd)
- Ogg Vorbis (.ogg)
- SampleVision (.smp)
- Spectral Bitmap Image (.bmp)
- Windows Media Audio (.wma)
- Windows PCM (.wav, .bwf)
- PCM Raw Data (.pcm, .raw)
- Video file formats
- Adding file information
- Chapter 15: Automating tasks
- Chapter 16: Building audio CDs
- Chapter 17: Keyboard shortcuts
- Chapter 18: Digital audio glossary
- Index
ADOBE AUDITION 3.0
User Guide
94
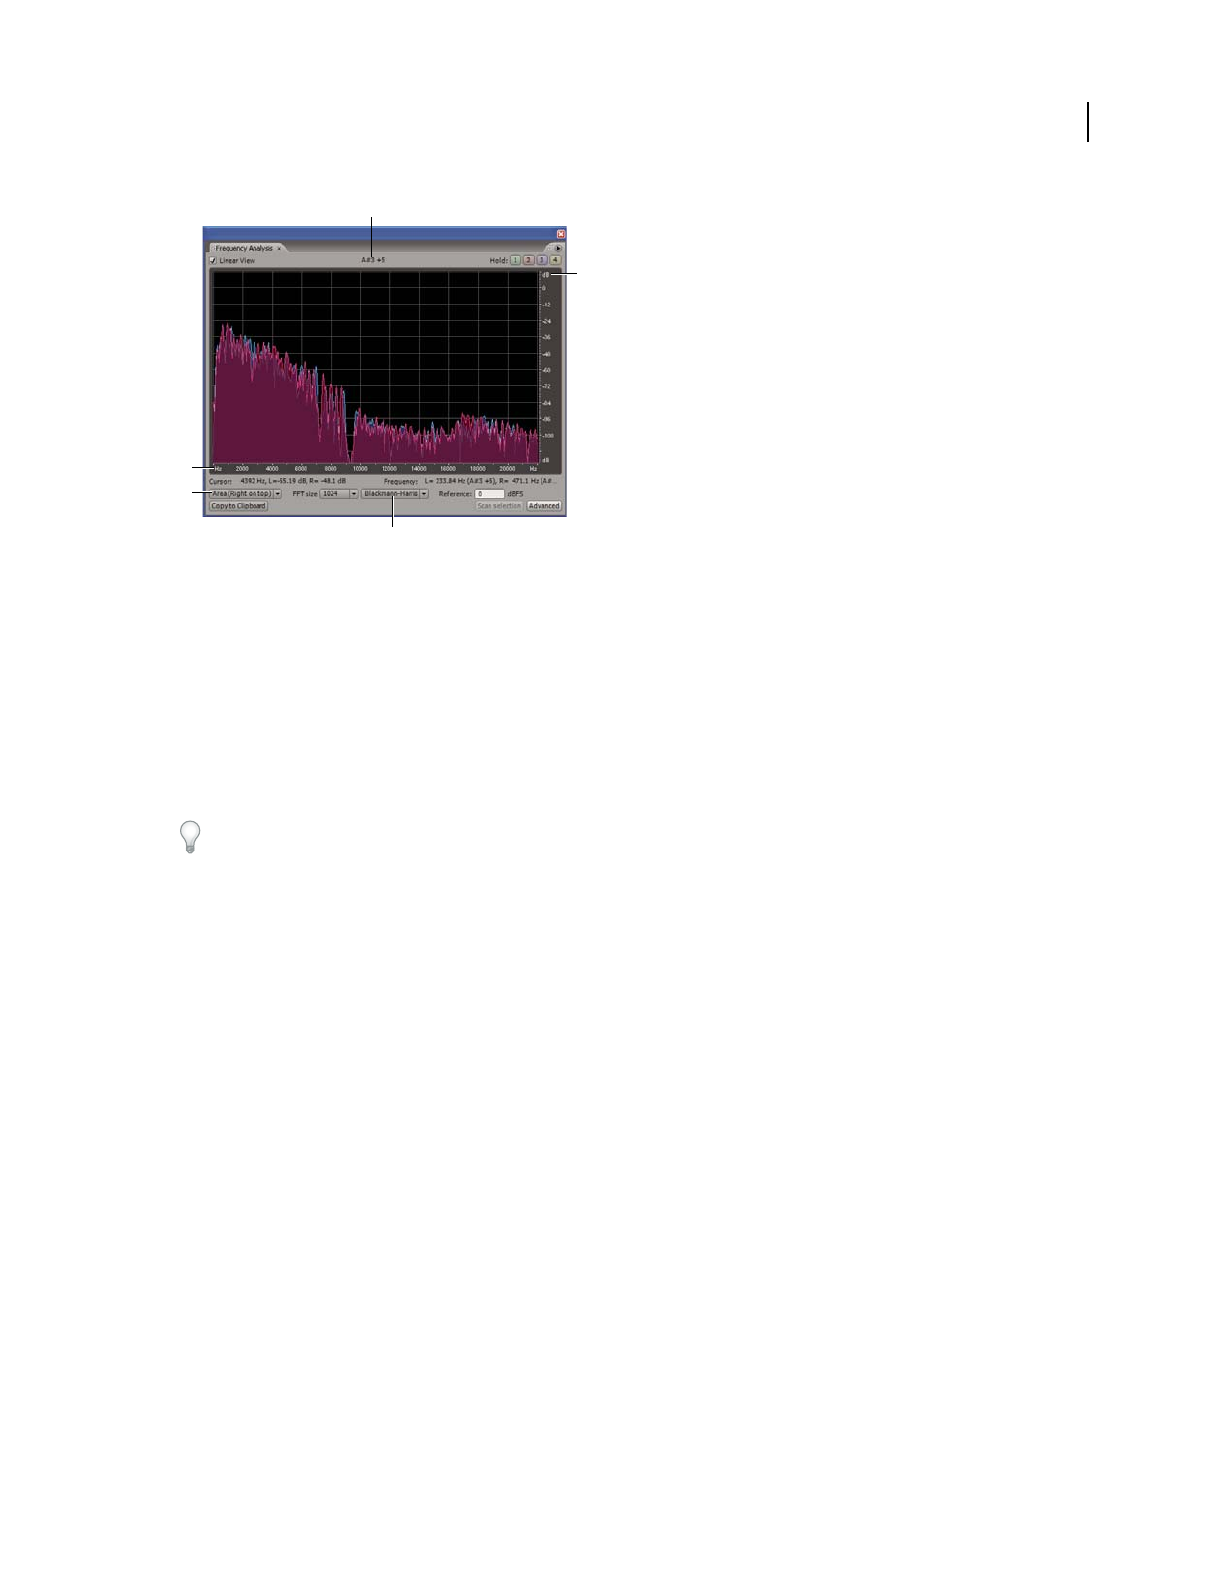
Frequency Analysis panel displaying Advanced options
A. Musical note B. Frequency scale C. Chart format D. Amplitude scale E. FFT window type
1 In Edit View, choose Window > Frequency Analysis.
2 In the Main panel, click a point, select a range, or start playback.
If you select a range, Adobe Audition analyzes only the center point. To analyze the overall frequency of a selected
range, click Scan Selection in the Frequency Analysis panel.
3 View frequency and amplitude information in the Frequency Analysis panel:
• The graph displays frequency along the horizontal axis and amplitude on the vertical axis.
To zoom in on a particular area of the graph, right-click on a ruler and drag the magnifying glass icon. (See “Zoom
phase and frequency graphs” on page 95.)
• The musical note of the waveform is displayed in the area above the graph. The numbers indicate the keyboard
position and variance from standard tuning. For example, A2 +7 equals the second-lowest A on a keyboard tuned
7% higher than normal.
• The highest frequency of the entire waveform and the maximum amplitude for each channel is displayed in the
left status area underneath the graph.
• The overall frequency (and equivalent musical note) at the center point of the selected range is displayed in the
right status area underneath the graph.
Frequency Analysis options
Set the following options to customize the Frequency Analysis panel:
Linear View Sets the graph display to a linear horizontal frequency scale when selected or a logarithmic scale when
deselected.
Hold buttons Let you take up to four frequency snapshots as a waveform is playing. The frequency outline (which
is rendered in the same color as the button clicked) is frozen on the graph and overlaid on other frequency outlines.
Up to four frozen frequency outlines may be shown at once. To clear a frozen frequency outline, click its corre-
sponding Hold button again.
Chart Format menu Changes the graph display. Choose one of the following styles:
• Lines Displays amplitude at each frequency with simple lines. The left channel is blue; the right is red.
A
E
B
C
D