
Operation Manual
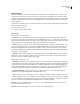
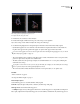
Table Of Contents
- Contents
- Chapter 1: Getting started
- Chapter 2: Digital audio fundamentals
- Chapter 3: Workflow and workspace
- Chapter 4: Setting up Adobe Audition
- Chapter 5: Importing, recording, and playing audio
- Chapter 6: Editing audio files
- Displaying audio in Edit View
- Selecting audio
- Copying, cutting, pasting, and deleting audio
- Visually fading and changing amplitude
- Working with markers
- Creating and deleting silence
- Inverting and reversing audio
- Generating audio
- Analyzing phase, frequency, and amplitude
- Converting sample types
- Recovery and undo
- Chapter 7: Applying effects
- Chapter 8: Effects reference
- Amplitude and compression effects
- Delay and echo effects
- Filter and equalizer effects
- Modulation effects
- Restoration effects
- Reverb effects
- Special effects
- Stereo imagery effects
- Changing stereo imagery
- Binaural Auto-Panner effect (Edit View only)
- Center Channel Extractor effect
- Channel Mixer effect
- Doppler Shifter effect (Edit View only)
- Graphic Panner effect
- Pan/Expand effect (Edit View only)
- Stereo Expander effect
- Stereo Field Rotate VST effect
- Stereo Field Rotate process effect (Edit View only)
- Time and pitch manipulation effects
- Multitrack effects
- Chapter 9: Mixing multitrack sessions
- Chapter 10: Composing with MIDI
- Chapter 11: Loops
- Chapter 12: Working with video
- Chapter 13: Creating surround sound
- Chapter 14: Saving and exporting
- Saving and exporting files
- Audio file formats
- About audio file formats
- 64-bit doubles (RAW) (.dbl)
- 8-bit signed (.sam)
- A/mu-Law Wave (.wav)
- ACM Waveform (.wav)
- Amiga IFF-8SVX (.iff, .svx)
- Apple AIFF (.aif, .snd)
- ASCII Text Data (.txt)
- Audition Loop (.cel)
- Creative Sound Blaster (.voc)
- Dialogic ADPCM (.vox)
- DiamondWare Digitized (.dwd)
- DVI/IMA ADPCM (.wav)
- Microsoft ADPCM (.wav)
- mp3PRO (.mp3)
- NeXT/Sun (.au, .snd)
- Ogg Vorbis (.ogg)
- SampleVision (.smp)
- Spectral Bitmap Image (.bmp)
- Windows Media Audio (.wma)
- Windows PCM (.wav, .bwf)
- PCM Raw Data (.pcm, .raw)
- Video file formats
- Adding file information
- Chapter 15: Automating tasks
- Chapter 16: Building audio CDs
- Chapter 17: Keyboard shortcuts
- Chapter 18: Digital audio glossary
- Index
ADOBE AUDITION 3.0
User Guide
92
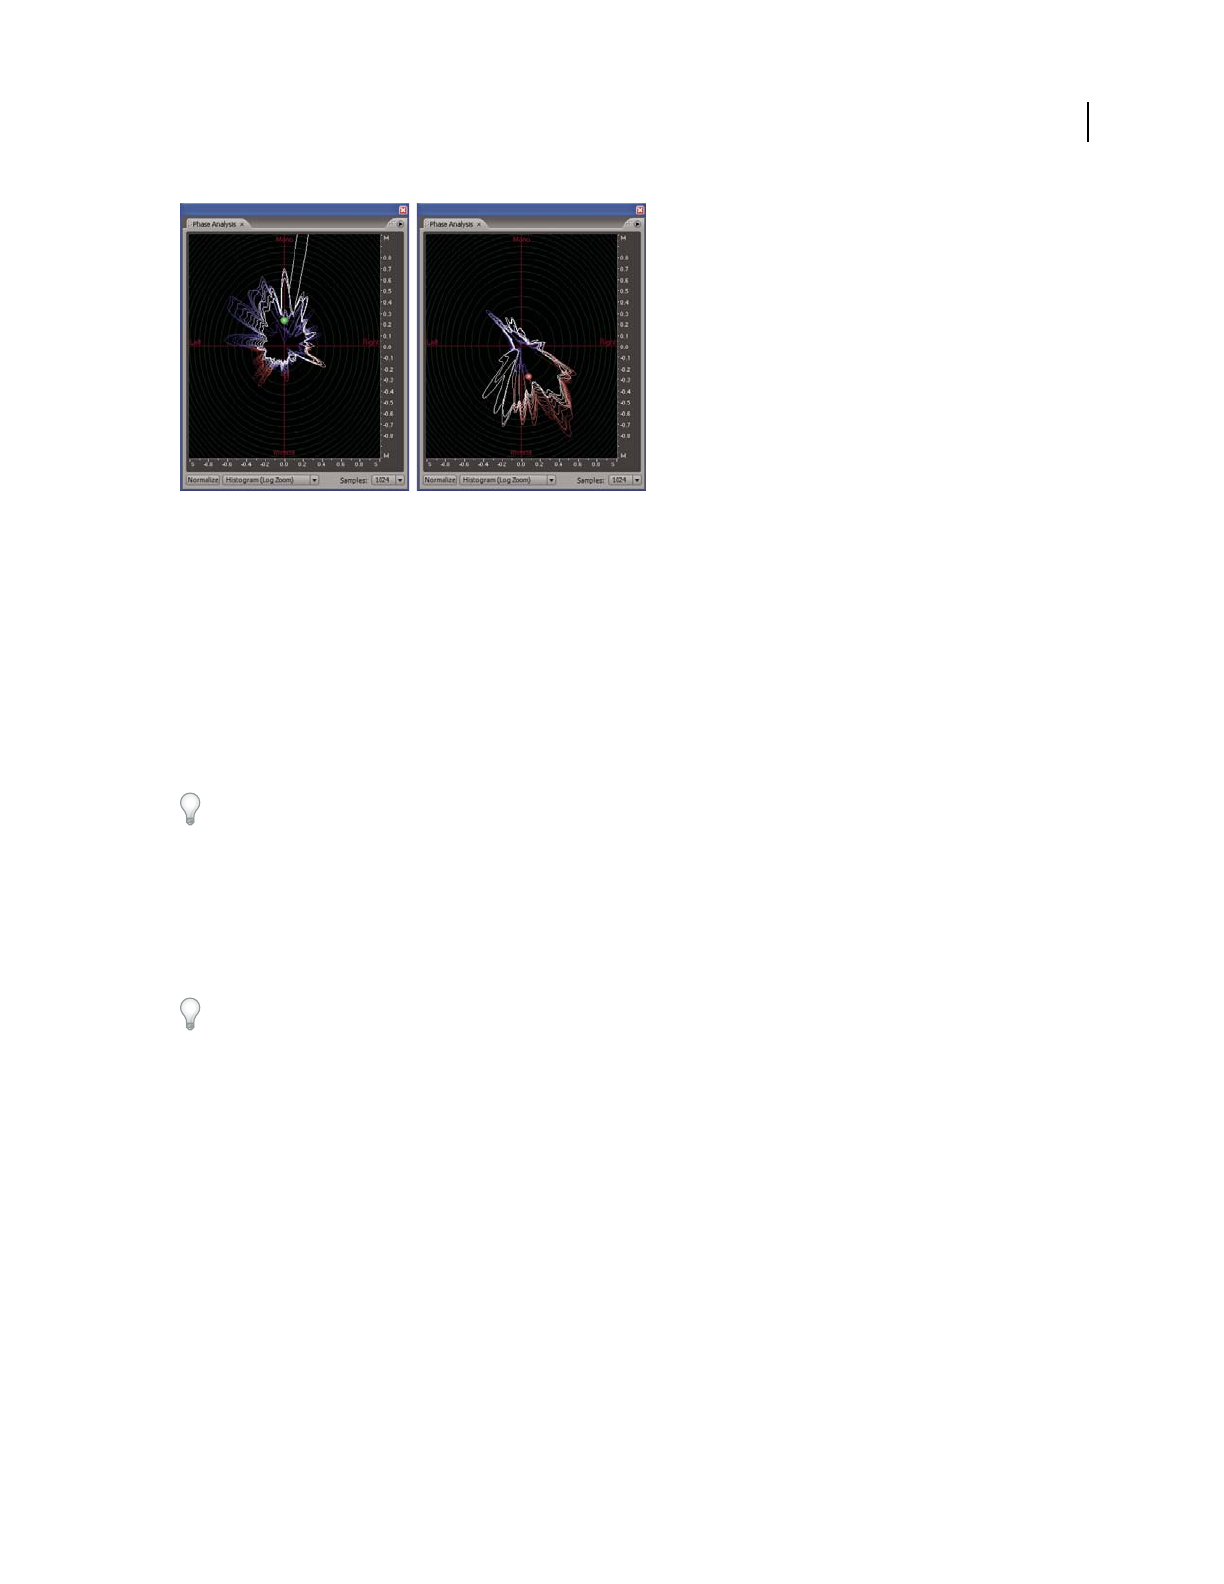
Phase Analysis panel using Histogram (Log Zoom) view:
A. In-phase audio B. Out-of-phase audio
1 In Edit View, choose Window > Phase Analysis.
2 In Waveform Display of Edit View, click a point, select a range, or start playback.
If you select a range, Adobe Audition analyzes the center point of the range.
3 Use the following display items to interpret the phase information shown in the Phase Analysis panel:
• By default, the graph shows stereo channels on the horizontal axis and phase information on the vertical axis.
In-phase audio appears in the top half of the graph; out-of-phase audio appears in the bottom half.
To zoom in on the graph, use the mouse wheel or right-click a ruler and drag the magnifying glass icon. (See “Zoom
phase and frequency graphs” on page 95.)
• The colored ball shows the overall stereo and phase location of audio. The ball turns red for out-of-phase audio,
green for in-phase audio, and yellow for borderline audio.
• The white outline shows the percentage of samples in each channel that are in- or out-of-phase, reflecting the
width of the stereo image.
Ifyouplantocreateamonoversionofastereofile(forAMradio,forexample),notethewidthofthestereoimage.
If it’s very broad, the file will sound significantly different in mono.
• The colored tracer lines indicate whether the waveform is more in phase (blue) or out of phase (red).
See also
“Invert a waveform” on page 87
“About Spectral Phase Display” on page 67
Phase Analysis options
Set the following options to customize the Phase Analysis panel:
Normalize Adjusts the phase analysis lines so that they reach the edge of the graph.
Chart Type menu Select from the following options:
• Left/Right Displays a Lissajou Plot graph in which a mono waveform appears as a diagonal line ascending from
left to right; a right-channel-only waveform appears as a horizontal line; a left-channel-only waveform appears as a
A
B