
Operation Manual
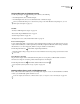
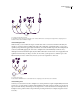
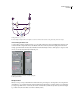
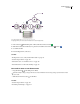
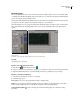
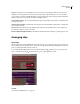
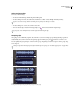
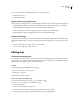
Table Of Contents
- Contents
- Chapter 1: Getting started
- Chapter 2: Digital audio fundamentals
- Chapter 3: Workflow and workspace
- Chapter 4: Setting up Adobe Audition
- Chapter 5: Importing, recording, and playing audio
- Chapter 6: Editing audio files
- Displaying audio in Edit View
- Selecting audio
- Copying, cutting, pasting, and deleting audio
- Visually fading and changing amplitude
- Working with markers
- Creating and deleting silence
- Inverting and reversing audio
- Generating audio
- Analyzing phase, frequency, and amplitude
- Converting sample types
- Recovery and undo
- Chapter 7: Applying effects
- Chapter 8: Effects reference
- Amplitude and compression effects
- Delay and echo effects
- Filter and equalizer effects
- Modulation effects
- Restoration effects
- Reverb effects
- Special effects
- Stereo imagery effects
- Changing stereo imagery
- Binaural Auto-Panner effect (Edit View only)
- Center Channel Extractor effect
- Channel Mixer effect
- Doppler Shifter effect (Edit View only)
- Graphic Panner effect
- Pan/Expand effect (Edit View only)
- Stereo Expander effect
- Stereo Field Rotate VST effect
- Stereo Field Rotate process effect (Edit View only)
- Time and pitch manipulation effects
- Multitrack effects
- Chapter 9: Mixing multitrack sessions
- Chapter 10: Composing with MIDI
- Chapter 11: Loops
- Chapter 12: Working with video
- Chapter 13: Creating surround sound
- Chapter 14: Saving and exporting
- Saving and exporting files
- Audio file formats
- About audio file formats
- 64-bit doubles (RAW) (.dbl)
- 8-bit signed (.sam)
- A/mu-Law Wave (.wav)
- ACM Waveform (.wav)
- Amiga IFF-8SVX (.iff, .svx)
- Apple AIFF (.aif, .snd)
- ASCII Text Data (.txt)
- Audition Loop (.cel)
- Creative Sound Blaster (.voc)
- Dialogic ADPCM (.vox)
- DiamondWare Digitized (.dwd)
- DVI/IMA ADPCM (.wav)
- Microsoft ADPCM (.wav)
- mp3PRO (.mp3)
- NeXT/Sun (.au, .snd)
- Ogg Vorbis (.ogg)
- SampleVision (.smp)
- Spectral Bitmap Image (.bmp)
- Windows Media Audio (.wma)
- Windows PCM (.wav, .bwf)
- PCM Raw Data (.pcm, .raw)
- Video file formats
- Adding file information
- Chapter 15: Automating tasks
- Chapter 16: Building audio CDs
- Chapter 17: Keyboard shortcuts
- Chapter 18: Digital audio glossary
- Index
ADOBE AUDITION 3.0
User Guide
191
Graph Shows the track’s current equalization curve. The x-axis represents frequency, while the y-axis represents
amplitude. You can drag the three control points around the graph to adjust the EQ curve. As you do, the sliders
move to reflect your changes. Initially, the leftmost control point represents the low frequency, and the middle and
rightmost control points correspond to the middle and high frequencies.
Vertical amplitude sliders Boost or attenuate the three frequency bands. Either drag the sliders or click the blue text
to enter precise values.
Horizontal frequency sliders Determine the center frequency for each band. Either drag the sliders or click the blue
text to enter precise values.
Q values Define the width of each band. (Higher values equal narrower bandwidth, and vice versa.) Either drag
across the text or click it to enter precise values.
Band/Low Shelf, Band/High Shelf buttons Switchthefirstandthirdbandsfromshelvingtopeaking,andviceversa.
Arranging clips
About clips
WhenyouinsertanaudiofileinMultitrackView,thefilebecomesaclipontheselectedtrack.Youcaneasilymove
clips to different tracks or timeline positions. You can also edit clips nondestructively, trimming their start and end
points, crossfading them with other clips, and more.
To work with clips in the Main panel, you can use either the Hybrid tool , which lets you move clips and select
ranges, or the Move/Copy Clip and Time Selection tools, which separate those tasks.
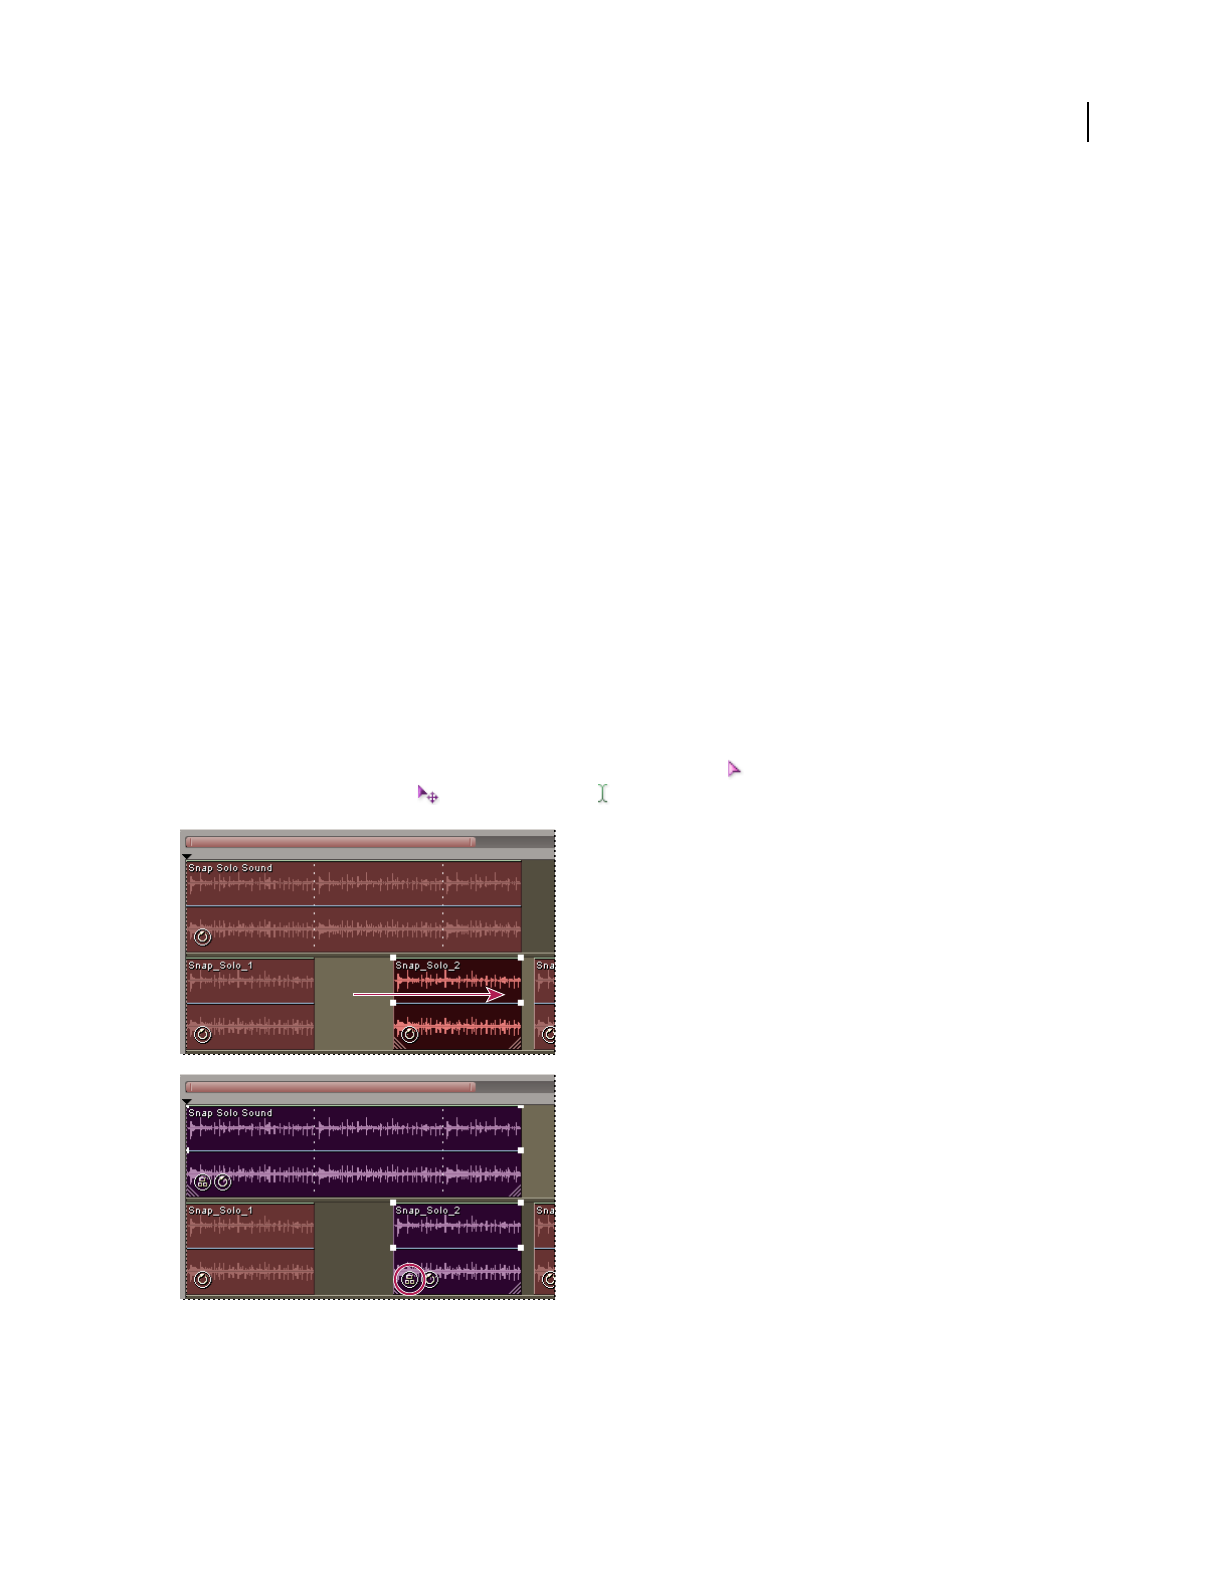
Aligning and grouping two clips
See also
“Select ranges in Multitrack View” on page 181