
Operation Manual
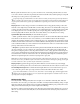
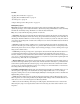
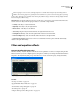
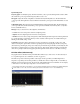
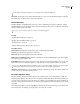
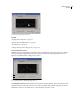
Table Of Contents
- Contents
- Chapter 1: Getting started
- Chapter 2: Digital audio fundamentals
- Chapter 3: Workflow and workspace
- Chapter 4: Setting up Adobe Audition
- Chapter 5: Importing, recording, and playing audio
- Chapter 6: Editing audio files
- Displaying audio in Edit View
- Selecting audio
- Copying, cutting, pasting, and deleting audio
- Visually fading and changing amplitude
- Working with markers
- Creating and deleting silence
- Inverting and reversing audio
- Generating audio
- Analyzing phase, frequency, and amplitude
- Converting sample types
- Recovery and undo
- Chapter 7: Applying effects
- Chapter 8: Effects reference
- Amplitude and compression effects
- Delay and echo effects
- Filter and equalizer effects
- Modulation effects
- Restoration effects
- Reverb effects
- Special effects
- Stereo imagery effects
- Changing stereo imagery
- Binaural Auto-Panner effect (Edit View only)
- Center Channel Extractor effect
- Channel Mixer effect
- Doppler Shifter effect (Edit View only)
- Graphic Panner effect
- Pan/Expand effect (Edit View only)
- Stereo Expander effect
- Stereo Field Rotate VST effect
- Stereo Field Rotate process effect (Edit View only)
- Time and pitch manipulation effects
- Multitrack effects
- Chapter 9: Mixing multitrack sessions
- Chapter 10: Composing with MIDI
- Chapter 11: Loops
- Chapter 12: Working with video
- Chapter 13: Creating surround sound
- Chapter 14: Saving and exporting
- Saving and exporting files
- Audio file formats
- About audio file formats
- 64-bit doubles (RAW) (.dbl)
- 8-bit signed (.sam)
- A/mu-Law Wave (.wav)
- ACM Waveform (.wav)
- Amiga IFF-8SVX (.iff, .svx)
- Apple AIFF (.aif, .snd)
- ASCII Text Data (.txt)
- Audition Loop (.cel)
- Creative Sound Blaster (.voc)
- Dialogic ADPCM (.vox)
- DiamondWare Digitized (.dwd)
- DVI/IMA ADPCM (.wav)
- Microsoft ADPCM (.wav)
- mp3PRO (.mp3)
- NeXT/Sun (.au, .snd)
- Ogg Vorbis (.ogg)
- SampleVision (.smp)
- Spectral Bitmap Image (.bmp)
- Windows Media Audio (.wma)
- Windows PCM (.wav, .bwf)
- PCM Raw Data (.pcm, .raw)
- Video file formats
- Adding file information
- Chapter 15: Automating tasks
- Chapter 16: Building audio CDs
- Chapter 17: Keyboard shortcuts
- Chapter 18: Digital audio glossary
- Index
ADOBE AUDITION 3.0
User Guide
135
If this option is selected, the entire selected range is equalized at the settings shown.
If this option is deselected, you can specify separate initial and final equalization settings, so that the selection can
smoothly glide from the initial equalization setting to the final setting over the selected range. Click the Initial
Settings and Final Settings tabs to specify initial and final settings.
Initial Settings tab Appears if Lock To These Settings Only is deselected. Click this tab to specify the initial EQ
settings.
Final Settings tab Appears if Lock To These Settings Only is deselected. Click this tab to specify the final EQ
settings.
Equalizer band sliders Increase or decrease the frequency specified beneath each slider. Amplitude appears above
each slider.
Master Gain sliders Adjust the equalizer’s overall level for both the left and right channels of stereo waveforms.
If you increase the EQ frequencies of a waveform, the waveform’s volume usually increases too, potentially leading
to clipping. Use the Master Gain sliders to reduce the level before applying the effect.
Lock L/R Lets you adjust channels together or separately. Select this option to adjust the channels together,
maintaining the same settings for each. Leave this option unselected to adjust each channel separately.
To produce a low-pass filter, set the higher frequency scroll bars to -30. Similarly, you can create a high-pass filter by
reducing the lower frequencies.
Scientific Filters effect (Edit View only)
The Filter And EQ > Scientific Filters effect provides high-order IIR (Infinite Impulse Response) filters for precise
band-pass, notch, or high- or low-pass filtering. The most common types of high-order filters are available: Bessel,
Butterworth, Chebychev 1, and Chebychev 2. Each type has different characteristics for filter attenuation and the
steepness of transition bands at cutoff points. Butterworth usually provides the best compromise between quality and
precision.
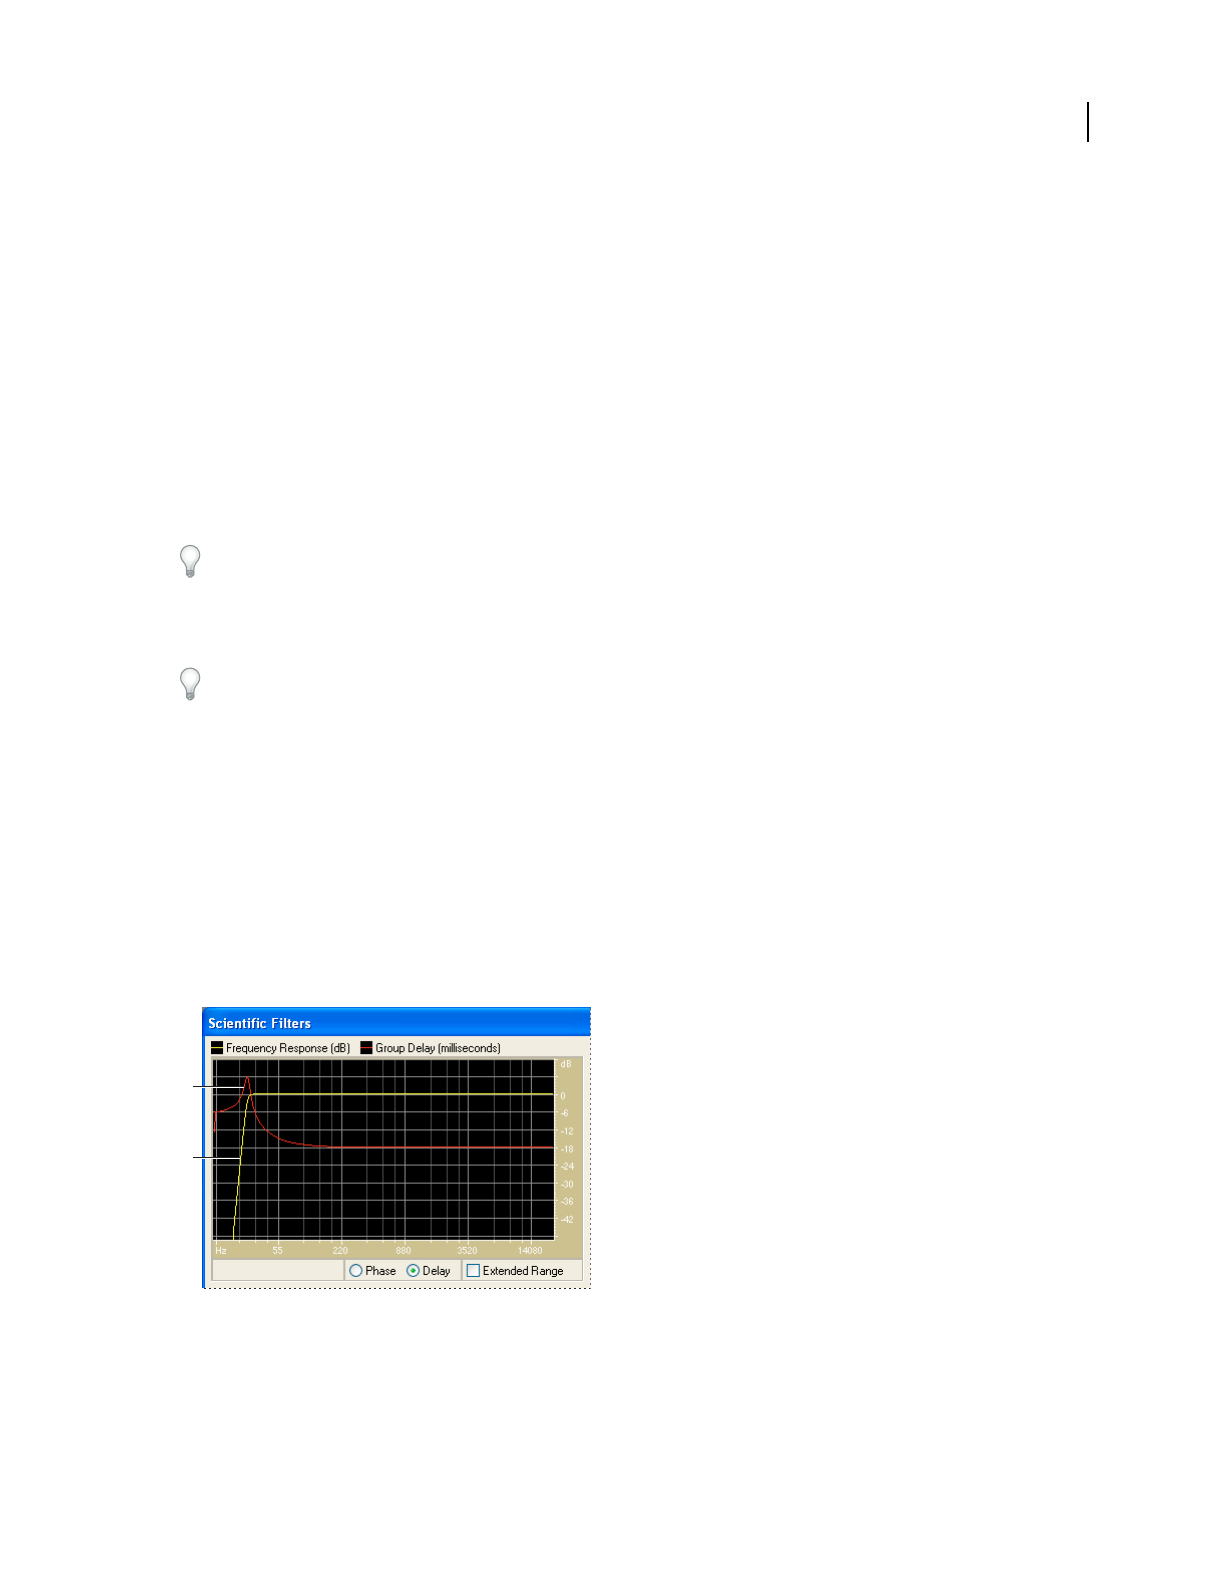
On the Scientific Filters graph, one line shows frequency response (measured in decibels), and the other line shows
either phase (measured in degrees) or group delay (measured in milliseconds), depending on whether the Phase or
Delay option is selected. Increase the graph’s display range by selecting Extended Range.
Scientific Filters graph for Butterworth filter (Remove Subsonic Rumble preset)
A. Group Delay (milliseconds) B. Frequency Response (dB)
A
B