
Operation Manual
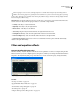
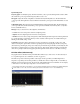
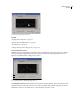
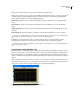
Table Of Contents
- Contents
- Chapter 1: Getting started
- Chapter 2: Digital audio fundamentals
- Chapter 3: Workflow and workspace
- Chapter 4: Setting up Adobe Audition
- Chapter 5: Importing, recording, and playing audio
- Chapter 6: Editing audio files
- Displaying audio in Edit View
- Selecting audio
- Copying, cutting, pasting, and deleting audio
- Visually fading and changing amplitude
- Working with markers
- Creating and deleting silence
- Inverting and reversing audio
- Generating audio
- Analyzing phase, frequency, and amplitude
- Converting sample types
- Recovery and undo
- Chapter 7: Applying effects
- Chapter 8: Effects reference
- Amplitude and compression effects
- Delay and echo effects
- Filter and equalizer effects
- Modulation effects
- Restoration effects
- Reverb effects
- Special effects
- Stereo imagery effects
- Changing stereo imagery
- Binaural Auto-Panner effect (Edit View only)
- Center Channel Extractor effect
- Channel Mixer effect
- Doppler Shifter effect (Edit View only)
- Graphic Panner effect
- Pan/Expand effect (Edit View only)
- Stereo Expander effect
- Stereo Field Rotate VST effect
- Stereo Field Rotate process effect (Edit View only)
- Time and pitch manipulation effects
- Multitrack effects
- Chapter 9: Mixing multitrack sessions
- Chapter 10: Composing with MIDI
- Chapter 11: Loops
- Chapter 12: Working with video
- Chapter 13: Creating surround sound
- Chapter 14: Saving and exporting
- Saving and exporting files
- Audio file formats
- About audio file formats
- 64-bit doubles (RAW) (.dbl)
- 8-bit signed (.sam)
- A/mu-Law Wave (.wav)
- ACM Waveform (.wav)
- Amiga IFF-8SVX (.iff, .svx)
- Apple AIFF (.aif, .snd)
- ASCII Text Data (.txt)
- Audition Loop (.cel)
- Creative Sound Blaster (.voc)
- Dialogic ADPCM (.vox)
- DiamondWare Digitized (.dwd)
- DVI/IMA ADPCM (.wav)
- Microsoft ADPCM (.wav)
- mp3PRO (.mp3)
- NeXT/Sun (.au, .snd)
- Ogg Vorbis (.ogg)
- SampleVision (.smp)
- Spectral Bitmap Image (.bmp)
- Windows Media Audio (.wma)
- Windows PCM (.wav, .bwf)
- PCM Raw Data (.pcm, .raw)
- Video file formats
- Adding file information
- Chapter 15: Automating tasks
- Chapter 16: Building audio CDs
- Chapter 17: Keyboard shortcuts
- Chapter 18: Digital audio glossary
- Index

ADOBE AUDITION 3.0
User Guide
131
Precision Factor Determines how accurately you want to filter over time when separate initial and final settings are
used. A larger number (low factor) causes the filter settings to change roughly (or in chunks) from initial to final,
while smaller numbers (higher factor) make the transition much smoother. In any case, the higher the precision
factor, the longer the processing time, but the nicer the effect will sound.
Since the FFT function takes a large group of samples and filters them all at once, the precision factor determines
how many samples from the entire group are actually saved. A factor of 2 means that 1/2 of the samples are saved,
while a factor of 10 means that 1/10 of the samples are saved. Since you can have only one filter setting for the entire
group of samples, use a more accurate (smaller) setting if the EQ curve varies wildly over short periods of time.
Transition Curve Opens the Transition Curve window, which displays a graphical representation of the transition
from initial to final filter settings. The top graph shows time along the x-axis (where the left represents the start of
the sample, and the right represents the end), and the transition percentage along the y-axis (where 0% represents
the initial filter, and 100% represents the final filter).
The Graph Response At Point option causes the lower readout to change in response to cursor position in the graph
above, visually representing the filter at any point in the transition. Depending on the position you select, you can
specify a morphing transition or a linear transition.
Graphic Equalizer effect
The Filter And EQ > Graphic Equalizer effect boosts or cuts specific frequency bands and provides a visual repre-
sentation of the resulting EQ curve. Unlike the Parametric Equalizer, the Graphic Equalizer uses preset frequency
bands for quick and easy equalization. The fixed Q settings ensure that no drop outs exist at intermediate
frequencies. You can space frequency bands at intervals of one octave, one-half octave, or one-third octave.
The Graphic Equalizer effect is an FIR (Finite Impulse Response) filter, which maintains phase accuracy—unlike an
IIR (Infinite Impulse Response) filter, which can introduce phase errors, adding a ringing quality to audio.
See also
“Applying effects in Edit View” on page 106
“Applying effects in Multitrack View” on page 107
“Use effect presets” on page 104
“Add preroll and postroll to effects previews” on page 107
Graphic Equalizer options
Bands buttons Let you access the number of EQ bands you need. Graphic Equalizer bands are spaced at intervals of
one octave (10 bands), one-half octave (20 bands), or one-third octave (30 bands). The 10 Bands setting offers more
general equalizing, while the 20 and 30 Band settings let you zoom in more precisely on specific frequency ranges.
Other than the bands settings, the controls in each section of the Graphic Equalizer window are identical.
Band Determines the band to be modified with the Gain value.
Gain Sets the exact boost or attenuation (measured in decibels) for the chosen band.
Range Defines the range of the slider controls. Enter any value between 4 and 180 dB. (By comparison, standard
hardware equalizers have a range of about 30 to 48 dB.)
Accuracy Sets the accuracy level for equalization. Higher accuracy levels (longer FIR filters) give better frequency
response in the lower ranges, but they require more processing time. If you equalize only higher frequencies, you can
use lower accuracy levels.