
Operation Manual
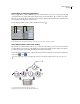

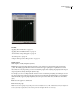
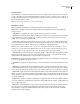
Table Of Contents
- Contents
- Chapter 1: Getting started
- Chapter 2: Digital audio fundamentals
- Chapter 3: Workflow and workspace
- Chapter 4: Setting up Adobe Audition
- Chapter 5: Importing, recording, and playing audio
- Chapter 6: Editing audio files
- Displaying audio in Edit View
- Selecting audio
- Copying, cutting, pasting, and deleting audio
- Visually fading and changing amplitude
- Working with markers
- Creating and deleting silence
- Inverting and reversing audio
- Generating audio
- Analyzing phase, frequency, and amplitude
- Converting sample types
- Recovery and undo
- Chapter 7: Applying effects
- Chapter 8: Effects reference
- Amplitude and compression effects
- Delay and echo effects
- Filter and equalizer effects
- Modulation effects
- Restoration effects
- Reverb effects
- Special effects
- Stereo imagery effects
- Changing stereo imagery
- Binaural Auto-Panner effect (Edit View only)
- Center Channel Extractor effect
- Channel Mixer effect
- Doppler Shifter effect (Edit View only)
- Graphic Panner effect
- Pan/Expand effect (Edit View only)
- Stereo Expander effect
- Stereo Field Rotate VST effect
- Stereo Field Rotate process effect (Edit View only)
- Time and pitch manipulation effects
- Multitrack effects
- Chapter 9: Mixing multitrack sessions
- Chapter 10: Composing with MIDI
- Chapter 11: Loops
- Chapter 12: Working with video
- Chapter 13: Creating surround sound
- Chapter 14: Saving and exporting
- Saving and exporting files
- Audio file formats
- About audio file formats
- 64-bit doubles (RAW) (.dbl)
- 8-bit signed (.sam)
- A/mu-Law Wave (.wav)
- ACM Waveform (.wav)
- Amiga IFF-8SVX (.iff, .svx)
- Apple AIFF (.aif, .snd)
- ASCII Text Data (.txt)
- Audition Loop (.cel)
- Creative Sound Blaster (.voc)
- Dialogic ADPCM (.vox)
- DiamondWare Digitized (.dwd)
- DVI/IMA ADPCM (.wav)
- Microsoft ADPCM (.wav)
- mp3PRO (.mp3)
- NeXT/Sun (.au, .snd)
- Ogg Vorbis (.ogg)
- SampleVision (.smp)
- Spectral Bitmap Image (.bmp)
- Windows Media Audio (.wma)
- Windows PCM (.wav, .bwf)
- PCM Raw Data (.pcm, .raw)
- Video file formats
- Adding file information
- Chapter 15: Automating tasks
- Chapter 16: Building audio CDs
- Chapter 17: Keyboard shortcuts
- Chapter 18: Digital audio glossary
- Index
ADOBE AUDITION 3.0
User Guide
114
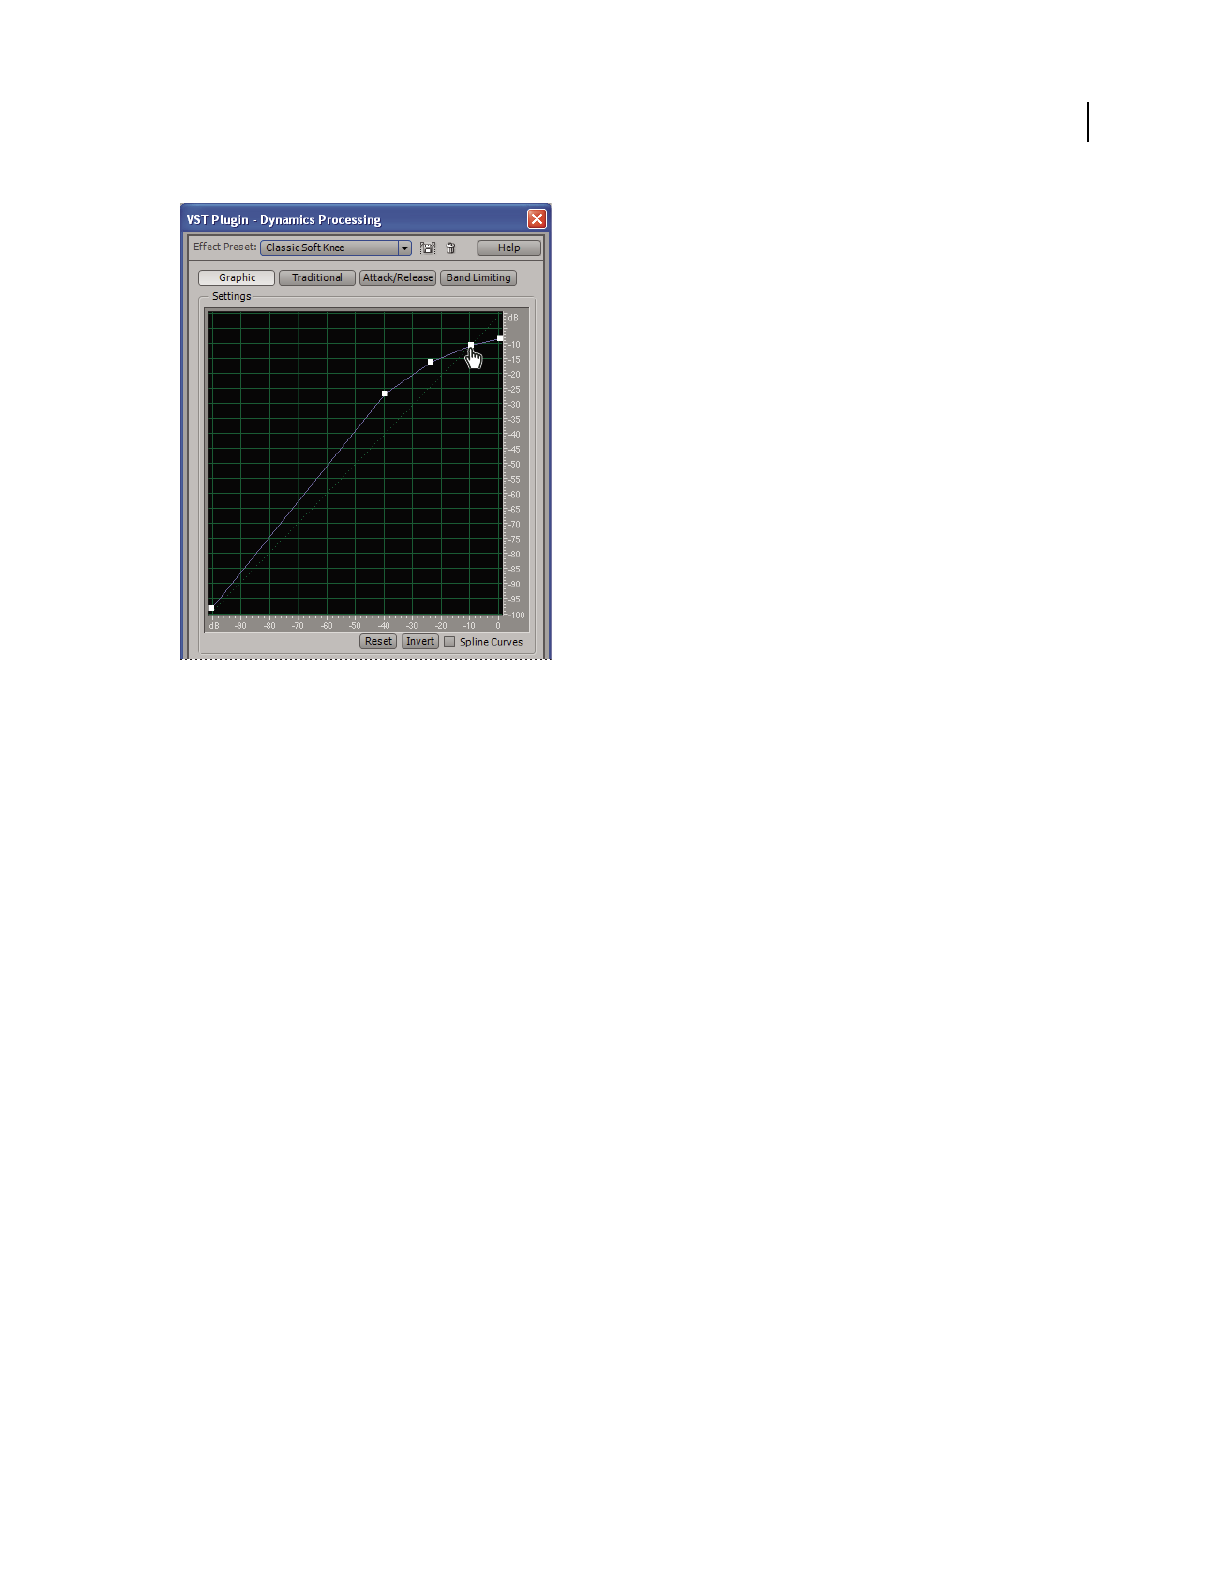
Dynamics Processing graph (Classic SoftKnee preset)
See also
“Applying effects in Edit View” on page 106
“Applying effects in Multitrack View” on page 107
“Control effects settings with graphs” on page 104
“Use effect presets” on page 104
“Add preroll and postroll to effects previews” on page 107
Graphic options
Click Graphic to visually manipulate dynamics.
Graph Depicts input level along the horizontal ruler (x-axis) and the new output level along the vertical ruler
(y-axis). The default graph, with a line from the lower left to the upper right, depicts a signal that has been left
untouched, since every input value goes to the exact matching output value. Adjusting the graph adjusts the input or
output assignments, thereby altering the dynamic range.
For example, you can boost all input that has a level of around -20 dB, leaving everything else unchanged. You can
also draw an inverse line (a line from the upper left to the lower right) that will dramatically boost low amplitudes
while dramatically suppressing high amplitudes (that is, all quiet sounds will be loud, and all loud sounds will be
quiet).
Reset Resets the graph to its default state.
Invert Inverts the graph.
Note: You can invert a graph only if it has points in the two default corners (-100, -100 and 0, 0) and if its output level
increases from left to right (that is, each control point must be higher than the one to its left).