
User Manual

________________________________________________________________________________________________________________
64
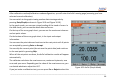
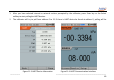
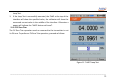
Figure10.9AsCal(GraphMode)
Aftercalibrationmethod/calibrationmodeconfiguration,youwillentertheAsCalrunningpage(assumingyouhave
selectedmanualcalibration).
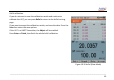
Youcanswitchtothegraphviewingmodeordataviewingmodeby
pressingData/Graph(asshowninFigure10.9andFigure10.10).
Inthegraphmode,youcanseeavisualreadingofthetrend
oferrors.In
thedatamode,youcanseethedetaildataanderrors.
Onthetopoftheerrorgraphchart,youcanseethemaximumtolerance
andsetpointvalues.
Onthebottomoftheerrorgraphchart,istheinputandoutput
information.
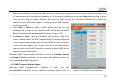
Youcansavethepoint
dataandcontinuetothenextpointuntilallpoints
areacceptedbypressingEnterorAccept.
Youcanskipthecurrentpoint(donotsavethepointdata)andcontinue
tothenextpointbypressingSkip.
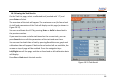
Whenallthesetpointsaredone,theAsCalcalibrationresults
willappear
automatically.
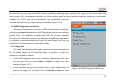
Thecalibra torcalculatesthemaximumerror,ma ximumhysteresis,zero
errorandspanerror.Dependingonthevalueofthemaximumerror,you
candecidewhethertoadjusttheUUT.
Ifyoujustmak eacalibrationtest,youcanpressEscorRejecttoabortthe