
Specifications
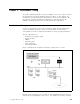


Table Of Contents
- IBM PC Server and Novell NetWare Integration Guide
- Abstract
- Contents
- Figures
- Tables
- Special Notices
- Preface
- Chapter 1. IBM PC Server Technologies
- Processors
- Clock Rate
- External Interfaces
- Processor Types
- Multiprocessing
- Memory
- Caches
- Memory Interleaving
- Dual Path Buses
- SynchroStream Technology
- Memory Error Detection and Correction
- Standard (Parity) Memory
- Error Correcting Code (ECC)
- Error Correcting Code- Parity Memory (ECC- P)
- ECC on SIMMs (EOS) Memory
- Performance Impact
- Memory Options and Speed
- Bus Architectures
- ISA Bus
- EISA Bus
- Micro Channel Bus
- PCI Bus
- Disk Subsystem
- Hard Disk Interfaces
- SCSI Technology
- SCSI Adapters
- Hard Disk Drives
- RAID Technology
- RAID Classifications
- Recommendations
- LAN Subsystem
- Shared RAM Adapters
- Bus Master Adapters
- PeerMaster Technology
- Security Features
- Tamper- Evident Cover
- Secure I/ O Cables
- Passwords
- Secure Removable Media
- Selectable Drive Startup
- Unattended Start Mode
- Systems Management
- DMI
- SNMP
- NetFinity
- SystemView
- Fault Tolerance
- NetWare SFT III
- Uninterruptible Power Supply (UPS)
- APC PowerChute
- Chapter 2. IBM PC Server Family Overview
- Chapter 3. Hardware Configuration
- The Setup Program
- Main Menu
- Advanced Menu
- Security
- EISA Configuration Utility
- SCSI Select Utility Program
- System Programs
- Starting From the System Partition
- Starting From the Reference Diskette
- Main Menu Options
- Backup/ Restore System Programs Menu
- Set Configuration Menu
- Set Features Menu
- Test the Computer
- More Utilities Menu
- Advanced Diagnostic Program
- RAID Controller Utility
- Drive Information
- Formatting the Disks
- Defining a Hot- Spare Disk
- Creating a Disk Array
- Defining Logical Drives
- Setting the Write Policy
- Initializing the Array
- Backup/ Restoring the Configuration
- Chapter 4. Novell NetWare Installation
- ServerGuide Overview
- Starting ServerGuide
- Installing NetWare 4.1 with ServerGuide
- Installing NetWare 3.12 with Diskettes
- Hardware Requirements
- Software Requirements
- Information Requested at Time of Installation
- Installation Files
- Installation Procedure
- Installing NetWare 4.1 with the Original CD- ROM
- Hardware Requirements
- Software Requirements
- Installation Procedure
- NetFinity Services for NetWare
- System Requirements
- Installing NetFinity Services for NetWare
- The RAID Administration for NetWare Utility
- Installing the Utility
- Hard Disk Failure Simulation
- Simulating with a Hot Spare Drive
- Simulating without a Hot Spare Drive
- Chapter 5. Performance Tuning
- Appendix A. EISA Configuration File
- Appendix B. Hardware Compatibility, Device Driver, and Software Patch Information
- Appendix C. Configuring DOS CD-ROM Support
- List of Abbreviations
- Index
- Special Characters C
- Numerics
- A
- B
- D
- E
- F
- H
- M
- I
- N
- K
- L
- O
- P
- S
- Q
- R
- T
- U
- V
- W
- Z
- ITSO Technical Bulletin Evaluation RED000
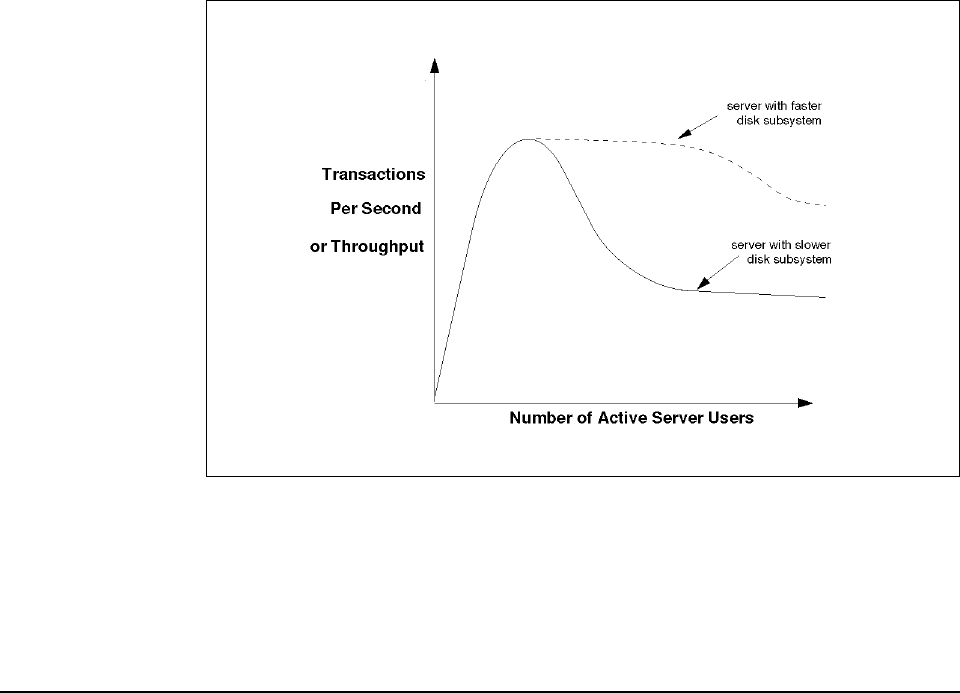
Figure 142. Differences in Disk Subsystems
Improving performance of the disk subsystem will usually prolong the maximum
transactions per second rate shown in Figure 142. The effect of a faster disk can
be to improve the disk cache hit rate. This is because write-data can be flushed
from the cache quicker, so that the amount of memory available for caching of
new data is increased.
5.2 Performance Analysis Tools
Using performance analysis tools is an effective method of understanding server
performance.
5.2.1 DatagLANce
IBM DatagLANce is one such tool that can give valuable insight into server
performance. DatagLANce operates at the physical layer and monitors the
actual frames being transmitted on the network.
You can use the DatagLANce analyzer to get an accurate picture of the current
activity on your network or a historical record of network activity over a specified
period of time. You can design your own screens and save them from the menu.
If you wish, you can create 32 different bar charts of real-time statistics, launch
an analysis session and call up frame summary views, protocol interpreted
views, and hexadecimal views (all color coded, highlighted, and tracked
simultaneously). You can rearrange the statistics, add to them, and save them
under a new name. You can use the DatagLANce analyzer′s alarms to let you
know when certain statistical thresholds, such as network utilization, are
reached. Since DatagLANce runs on top of OS/2, you can even use your
machine for other applications while the analyzer is monitoring your network.
The following is a summary of DatagLANce features:
•
88 source and destination address pairs filtered in real time
•
Real-time frame capture while monitoring
•
Eight fast, super-powerful, programmable event detectors
172 NetWare Integration Guide