
Technical information

Chapter 8. Capacity Manager 159
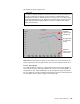
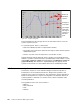
• Forecasted bottlenecks
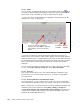
The performance analysis algorithm scans for bottlenecks on each system. If
no bottlenecks are found for a given system, then performance analysis scans
forward, using the forecasted graph.
The forecast is the same length as the report period. For example, a report
period of one month can have a forecast of one month into the future. The
forecast is used only if no bottlenecks are found in the real data. Only the first
bottleneck that is found in the forecast is reported.
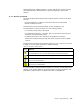
8.7.3 Setting critical and warning threshold values
The Report Viewer provides two thresholds, warning (yellow) and critical (red),
used to determine quickly which systems exceed preferred levels. These
threshold values appear in three places: as red and yellow cells in Table view, as
red and yellow lines on the Hypergraph, and on the graphs in the graph pane, and
in the function of performance analysis.
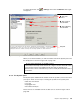
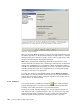
To set the Warning and Critical thresholds, click > Settings, then click the
Monitors tab. Figure 151 appears:
As shown in Figure 151, several of the monitors listed in the monitor window
are highlighted. The threshold settings for these monitors are critical to the
optimum function of the performance analysis. If you change the threshold
settings for these monitors, the effect on performance analysis will be
unpredictable.
Highlighted monitors