
Technical information

Chapter 8. Capacity Manager 153
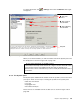
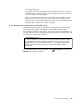
Figure145. Iconview(largeicons)
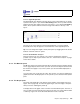
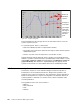
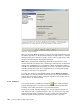
8.6.2.3 HyperGraph view
The HyperGraph view displays average values of the selected monitor for all the
systems in the report. If you click the Descending button, those systems with the
highest average value will be at the top of the report. If you click the Ascending
button, those systems with the lowest average value will be at the top of the
report.
Figure 146. HyperGraph view
The tops of the icons mark the values being displayed. If you have defined
thresholds, then they will appear as horizontal lines in the HyperGraph view.
Tip: You can change the height of the System pane by dragging down the border
between it and the other two panes.
8.6.2.4 Performance analysis
This new function lets you analyze your system for bottlenecks and offers
possible ways to improve performance. See 8.7, “Performance analysis” on page
156 for more details.
8.6.3 The Monitor pane
The Monitor pane in the lower left-hand side of the Report Viewer window (Figure
142 on page 150) lists the monitors you have chosen in the Report Generator. All
the monitors that apply to any of the systems you selected will be displayed on
the window.
You can select only one monitor at a time. The monitor you select is displayed in
graphical format in the Graph pane for the systems you’ve selected in the System
pane.
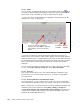
8.6.4 The Graph pane
The lower right-hand side of the Report Viewer window is the Graph pane (see
Figure 142 on page 150). To make the graph larger, select the edge of the pane
with your mouse and drag the panel up.
To display data on the graph, select a monitor from the Monitor pane, then one or
more systems from the System pane (select more than one system with the Shift
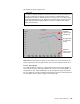
or Ctrl key). Figure 147 shows the CPU Utilization monitor selected.