
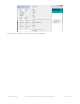
Datasheet
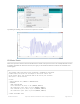
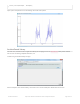
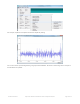

Try blowing or whistling at the sensor to see response in real time
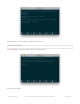
VU Meter Demo
Often times you don't want the actual audio data but the overall "sound pressure level". This example will take a bunch
of samples, normalize the data to be around 0, then give you the maximum difference between the waveforms for a
'volume graph'
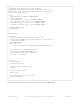
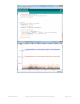
/*
This example reads audio data from an Invensense's ICS43432 I2S microphone
breakout board, and prints out the samples to the Serial console. The
Serial Plotter built into the Arduino IDE can be used to plot the audio
data (Tools -> Serial Plotter)
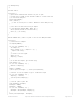
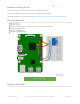
Circuit:
* Arduino/Genuino Zero, MKRZero or MKR1000 board
* ICS43432:
* GND connected GND
* 3.3V connected 3.3V (Zero) or VCC (MKR1000, MKRZero)
* WS connected to pin 0 (Zero) or pin 3 (MKR1000, MKRZero)
* CLK connected to pin 1 (Zero) or pin 2 (MKR1000, MKRZero)
* SD connected to pin 9 (Zero) or pin A6 (MKR1000, MKRZero)
created 17 November 2016
© Adafruit Industries https://learn.adafruit.com/adafruit-i2s-mems-microphone-breakout Page 13 of 30