
User's Manual
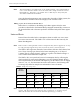
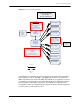
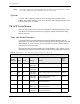
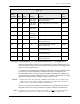
Table Of Contents
- Table of Contents
- Figures and Tables
- 1 - Introduction
- 2 - Functional Description
- 3 - Troubleshooting
- 4 - Specifications
- Acronyms
- Glossary
- Index

24 Universal Metering Transponder for kV2c™ Meter User Guide
Functional Description of the UMT-C-KV
N
OTE
The Demand Reset and shift must occur simultaneously, and a Demand Reset
can’t occur until 255 minutes after the Time/Date Stamp stored for the last
Demand Reset. Therefore it is possible that a shift may be delayed by the
255-minute RCE Demand Lockout.
Since the demand measurement may correspond to the utility’s billing system, the
Demand Reset command ensures the integrity of the customer’s bill.
Billing Cycle Read with Demand Reset
When there is a valid date in the Billing Cycle Date register #334, the same
procedure as described in the Demand Reset paragraph automatically executes on
the prescribed date and at the time specified in the Meter Daily Shift Time register
#332.
Interval Data
Interval data is described as the consumption values recorded over one or more
successive time intervals. The UMT-C-KV collects interval data from only the
Meter Data Registers.
N
OTE
Some features and capabilities of the transponder may not be supported, or may
be only partially supported by some versions of master station software.
The UMT-C-KV supports 4 channels of interval data collection. Each channel can
store 7 days of storage per channel at the fastest sampling rate, or 35 days of
5-minute data for a single channel, whichever is greater. The default setting is 1
active channel with a 60-minute sample rate.
The UMT-C-KV can report hourly interval consumption data by collecting the
data from the kV2c meter and transmitting it over the TWACS channel. Hourly
retrieval (60-minute) is the default read frequency, but the UMT-C-KV can supply
data in 5-, 10-, 15-, and 30-minute intervals as well. Refer to the following table
for storage days based on sample rate and number of active channels.
Table 2.7
Sample data storage days
N
OTE
The data is expressed as the difference between data values at successive points
in time. The interval used for interval data reporting (e.g. 60 min.) may be
different than the interval used for demand capture (e.g. 15 min.).
Number of
Active
Channels
Sample Rate
5 Minutes 10 Minutes 15 Minutes 30 Minutes 60 Minutes
1 35 70 105 210 420
2 17.5 35 52.5 105 210
3 11.67 23.33 35 70 140
4 8.75 17.5 26.25 52.5 105