
Installation guide

Reports
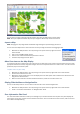
Watering information is recorded and stored in the controller and transferred to any PC that connects to it. The information
collected from the controller is vital to efficient management your irrigation system. This information may be accessed through
the “Reports” screen. Total water, water cycles and manual watering information is available for each zone.
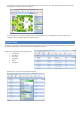
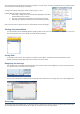
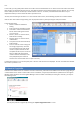
View a Report
To run a report, select the “Start Date” and “End Date” by clicking on the respective drop down calendars and selecting the
appropriate date. Click the “Run Program” button to view the report.
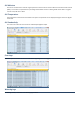
The report may be edited by selecting a new “Start Date” and “End Date”. The report's colors may be changed by clicking on
the colored rectangle in the legend near the top of the screen. The “Zoom” slider expands or contracts the size of each day
in the report.
Hover the mouse over a zone or any part of the report to display a description of that item.
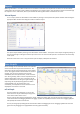
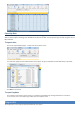
Zone Graphs
Sensor readings are recorded and stored in the controller
and are transferred to any PC that connects to it. This
information may be accessed through the “Zone Graphs”
screen. Zone graphs enable a visual view of soil moisture
readings. You can see the moisture level increase
dramatically when the system waters, as well as when it
rains. During the day, water in the soil evaporates and at
night the evaporation ceases. This is easily seen as the
moisture level flattens out during the night and begins to
drop during the day. Study these graphs to be better
acquainted with your soil characteristics. Soil
conductivity, soil temperature and soil moisture can be
displayed for each sensor in this view.
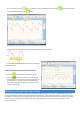
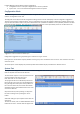
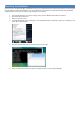
Edit a Graph
The graph shows the readings for one sensor at a
time. The sensor may be selected by clicking on the
sensor at the bottom of the screen.
Zoom in and out of the graph b y dragging the “Zoom” slider to the left or right. You can also zoom by holding the right
mouse button down and dragging the mouse. Dragging up/down will expand/contract the vertical axis. Dragging right/left
will expand/contract the horizontal axis.
You can pan the graph by holding the left mouse button down and dragging the mouse. Dragging up/down will move the
graph vertically. Dragging to the right/left will move the graph horizontally.