
Data Sheet

MCP3202
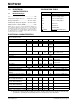
DS21034D-page 8 © 2006 Microchip Technology Inc.
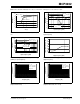
Note: Unless otherwise indicated, V
DD
= 5V, V
SS
= 0V, f
SAMPLE =
100 ksps,
f
CLK
= 18* f
SAMPLE
,T
A
= 25°C
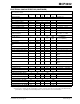
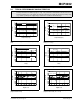
FIGURE 2-19: Gain Error vs. Temperature.
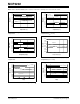
FIGURE 2-20: Signal to Noise Ratio (SNR) vs. Input
Frequency.
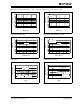
FIGURE 2-21: Total Harmonic Distortion (THD) vs.
Input Frequency.
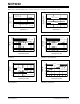
FIGURE 2-22: Offset Error vs. Temperature.
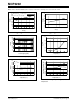
FIGURE 2-23: Signal to Noise and Distortion
(SINAD) vs. Input Frequency.
FIGURE 2-24: Signal to Noise and Distortion
(SINAD) vs. Signal Level.
-1.0
-0.8
-0.6
-0.4
-0.2
0.0
0.2
0.4
0.6
0.8
1.0
-50 -25 0 25 50 75 100
Temperature (°C)
Gain Error (LSB)
V
DD
= 5V
F
SAMPLE
= 100 ksps
V
DD
= 2.7V
F
SAMPLE
= 50 ksps
0
10
20
30
40
50
60
70
80
90
100
110100
Input Frequency (kHz)
SNR (dB)
V
DD
= 2.7V
F
SAMPLE
= 50 ksps
V
DD
= 5V
F
SAMPLE
= 100 ksps
-100
-90
-80
-70
-60
-50
-40
-30
-20
-10
0
1 10 100
Input Frequency (kHz)
THD (dB)
V
DD
= 2.7V
F
SAMPLE
= 50 ksps
V
DD
= 5V
F
SAMPLE
= 100 ksps
0.0
0.2
0.4
0.6
0.8
1.0
1.2
1.4
1.6
1.8
2.0
-50 -25 0 25 50 75 100
Temperature (°C)
Offset Error (LSB)
V
DD
= 5V
F
SAMPLE
= 100 ksps
V
DD
= 2.7V
F
SAMPLE
= 50 ksps
0
10
20
30
40
50
60
70
80
90
100
1 10 100
Input Frequency (kHz)
SINAD (dB)
V
DD
= 2.7V
F
SAMPLE
= 50 ksps
V
DD
= 5V
F
SAMPLE
= 100 ksps
0
10
20
30
40
50
60
70
80
-40 -35 -30 -25 -20 -15 -10 -5 0
Input Signal Level (dB)
SINAD (dB)
V
DD
= 2.7V
F
SAMPLE
= 50 ksps
V
DD
= 5V
F
SAMPLE
= 100 ksps