
Specifications


MultiWeigher 3000 Operations Manual Page 37
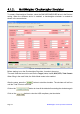
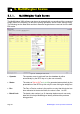
The sample report below has been generated from a single checkweigher.
The data in the report was printed after two separate short product production runs.
Figure 22 - Checkweigher Report
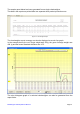
The checkweigher report summary can also be displayed as a color line graph.
In the example below the red Target weight was 500g, the green Average weight was
496.1g and the brown Standard deviation was 15.5.
The color histogram graph of a selected checkweigher can also be generated from the
report folder