
User's Manual


2 Using Loupe 3
7signal Ltd, Panuntie 6, FI-00620 HELSINKI, FINLAND, +358 40 777 7611, info@7signal.com, www.7signal.com
7signal Sapphire Loupe User Guide Release 3.1
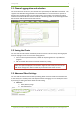
Note! The aggregation level can be chosen freely, but not all aggregation levels
can be used with all KPIs. In other words, when choosing the level of aggregation,
note the KPI being used. Loupe offers a default viewing level, but other viewing
levels might be just as suitable. If you change the level, Loupe uses that level
during the session.
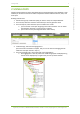
Area
Description
NW
Network level
AP
Access point level
APEye
One single managed access point of a
single monitoring station
APEyeAnt
One single managed access point of a
single monitoring station in particular
antenna direction
Eye
Single Eye
EyeAnt
An individual antenna in a chosen Eye
Dest
The Sonar to be tested
DestAP
The access point to be tested with relation
to Sonars
ChEye
An individual channel in a chosen Eye
ChEyeAnt
An individual antenna and channel in a
chosen Eye
QoSAP
Traffic belonging to a particular QoS level
on a single access point
Link
Link consists of a chain Eye - Access Point
– Sonar
All
Selects all elements
Note! The more detailed the chosen aggregation is, the more input one must give
in the topology tree. For example, ChEyeAnt aggregation requires input on the
channel, antenna and monitoring station for the request to be valid.
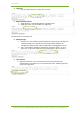
6. Alternatively, you can select Destinations from the tree hierarchy, and then select a
Sonar for which you want to display the results.
7. You can hide the KPI list by selecting Hide KPI
8. Click Generate to display the results.
The results open up in the same view / panel. Right clicking in graph will activate the chart
tooltips.
Note! Rendering the results may take a long time if you select a lot of data to be
calculated in single report.