
User's Manual


2 Using Loupe 2
7signal Ltd, Panuntie 6, FI-00620 HELSINKI, FINLAND, +358 40 777 7611, info@7signal.com, www.7signal.com
7signal Sapphire Loupe User Guide Release 3.1
2 USING LOUPE
Sapphire Carat gathers and stores data obtained from automated test to the database. Loupe
enables you to view the results and make comparisons between different devices, tests, and
time spans.
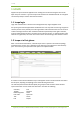
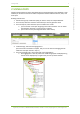
Building a Result View:
1. Decide which group of indicators (KPI) you want to view, for example Network
2. From the list, select the indicators from which you want to generate charts
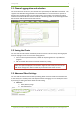
3. From the top bar, select the time span to include in the results
a. you can choose a time span by typing in the times and dates. You can either
type the date manually, or select it from a calendar.
b. you can also use the preconfigured values under History.
4. Under Average, select the averaging period
(The test results are based on samples, and you can use various averaging periods
within the time span chosen in step 3.)
5. From the Topology view, choose the level of area aggregation
a. Area aggregation is class by which test results are grouped and displayed. E.g.
results can be displayed by a single access point or by whole network.